Key takeaways
- Bitcoin ($BTC), Ethereum (ETH), and $XRP are starting the week on a more stable footing after last week’s declines.
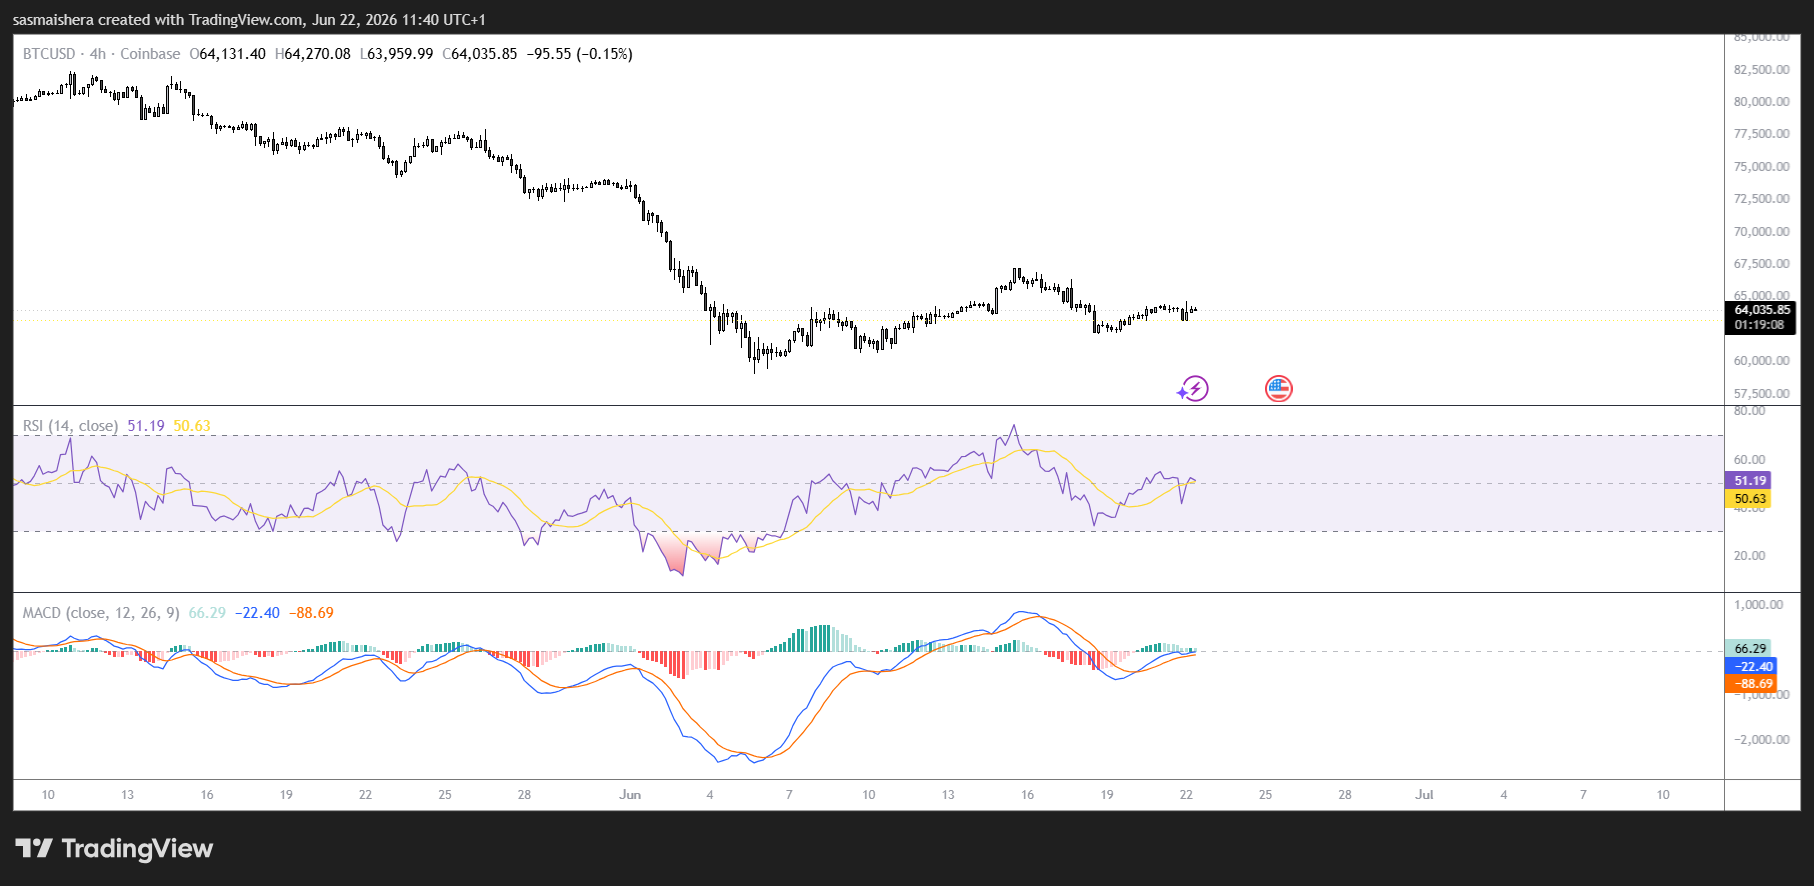
- $BTC is trading above $64,000 but remains below major moving averages, keeping the broader trend bearish.
Crypto market opens new weekly candle with signs of stability
Bitcoin, Ethereum, and $XRP are showing resilience at the start of the week after experiencing notable declines during the previous trading period.
Bitcoin fell nearly 4% last week, while Ethereum and $XRP dropped approximately 2% and 6%, respectively.
Despite the weakness, all three assets have stabilized, with Bitcoin trading above $64,000, Ethereum holding the critical $1,700 support level, and $XRP consolidating near $1.13.
For Bitcoin, traders are closely watching technical indicators for clues about whether the recent recovery can develop into a broader rebound.
Bitcoin remains below major resistance levels
Bitcoin is currently trading around $64,000, but the broader technical outlook remains cautious. $BTC continues to trade below its key moving averages, 50-day EMA: approximately $69,106, 100-day EMA: approximately $72,123, and 200-day EMA: approximately $77,748.
The fact that Bitcoin remains below all three indicators suggests that sellers still maintain control of the broader trend.
Adding to the bearish outlook, $BTC recently broke below a rising trendline that had previously supported the market. That trendline, now acting as resistance near $74,238, reinforces the view that Bitcoin remains in a corrective phase.
Although the overall trend remains weak, some technical indicators suggest that downside momentum may be slowing.
The Relative Strength Index (RSI) has rebounded from deeply oversold levels and is currently hovering in the high-40 range.
This improvement indicates that selling pressure has eased, but the indicator remains around the neutral 50 mark, meaning a clear bullish reversal has not yet been confirmed.
The Moving Average Convergence Divergence (MACD) indicator remains in positive territory, which is generally supportive for prices.
For Bitcoin to regain bullish momentum, buyers must overcome several resistance zones, including $69,106 (50-day EMA), $72,123 (100-day EMA), and $77,748 (200-day EMA).
A move above these levels would significantly improve the technical outlook and potentially signal the end of the current correction.
On the downside, the first major support level remains at $64,005.A decisive break below this area could expose Bitcoin to further losses and extend the existing downtrend.
Leave a Reply
You must be logged in to post a comment.