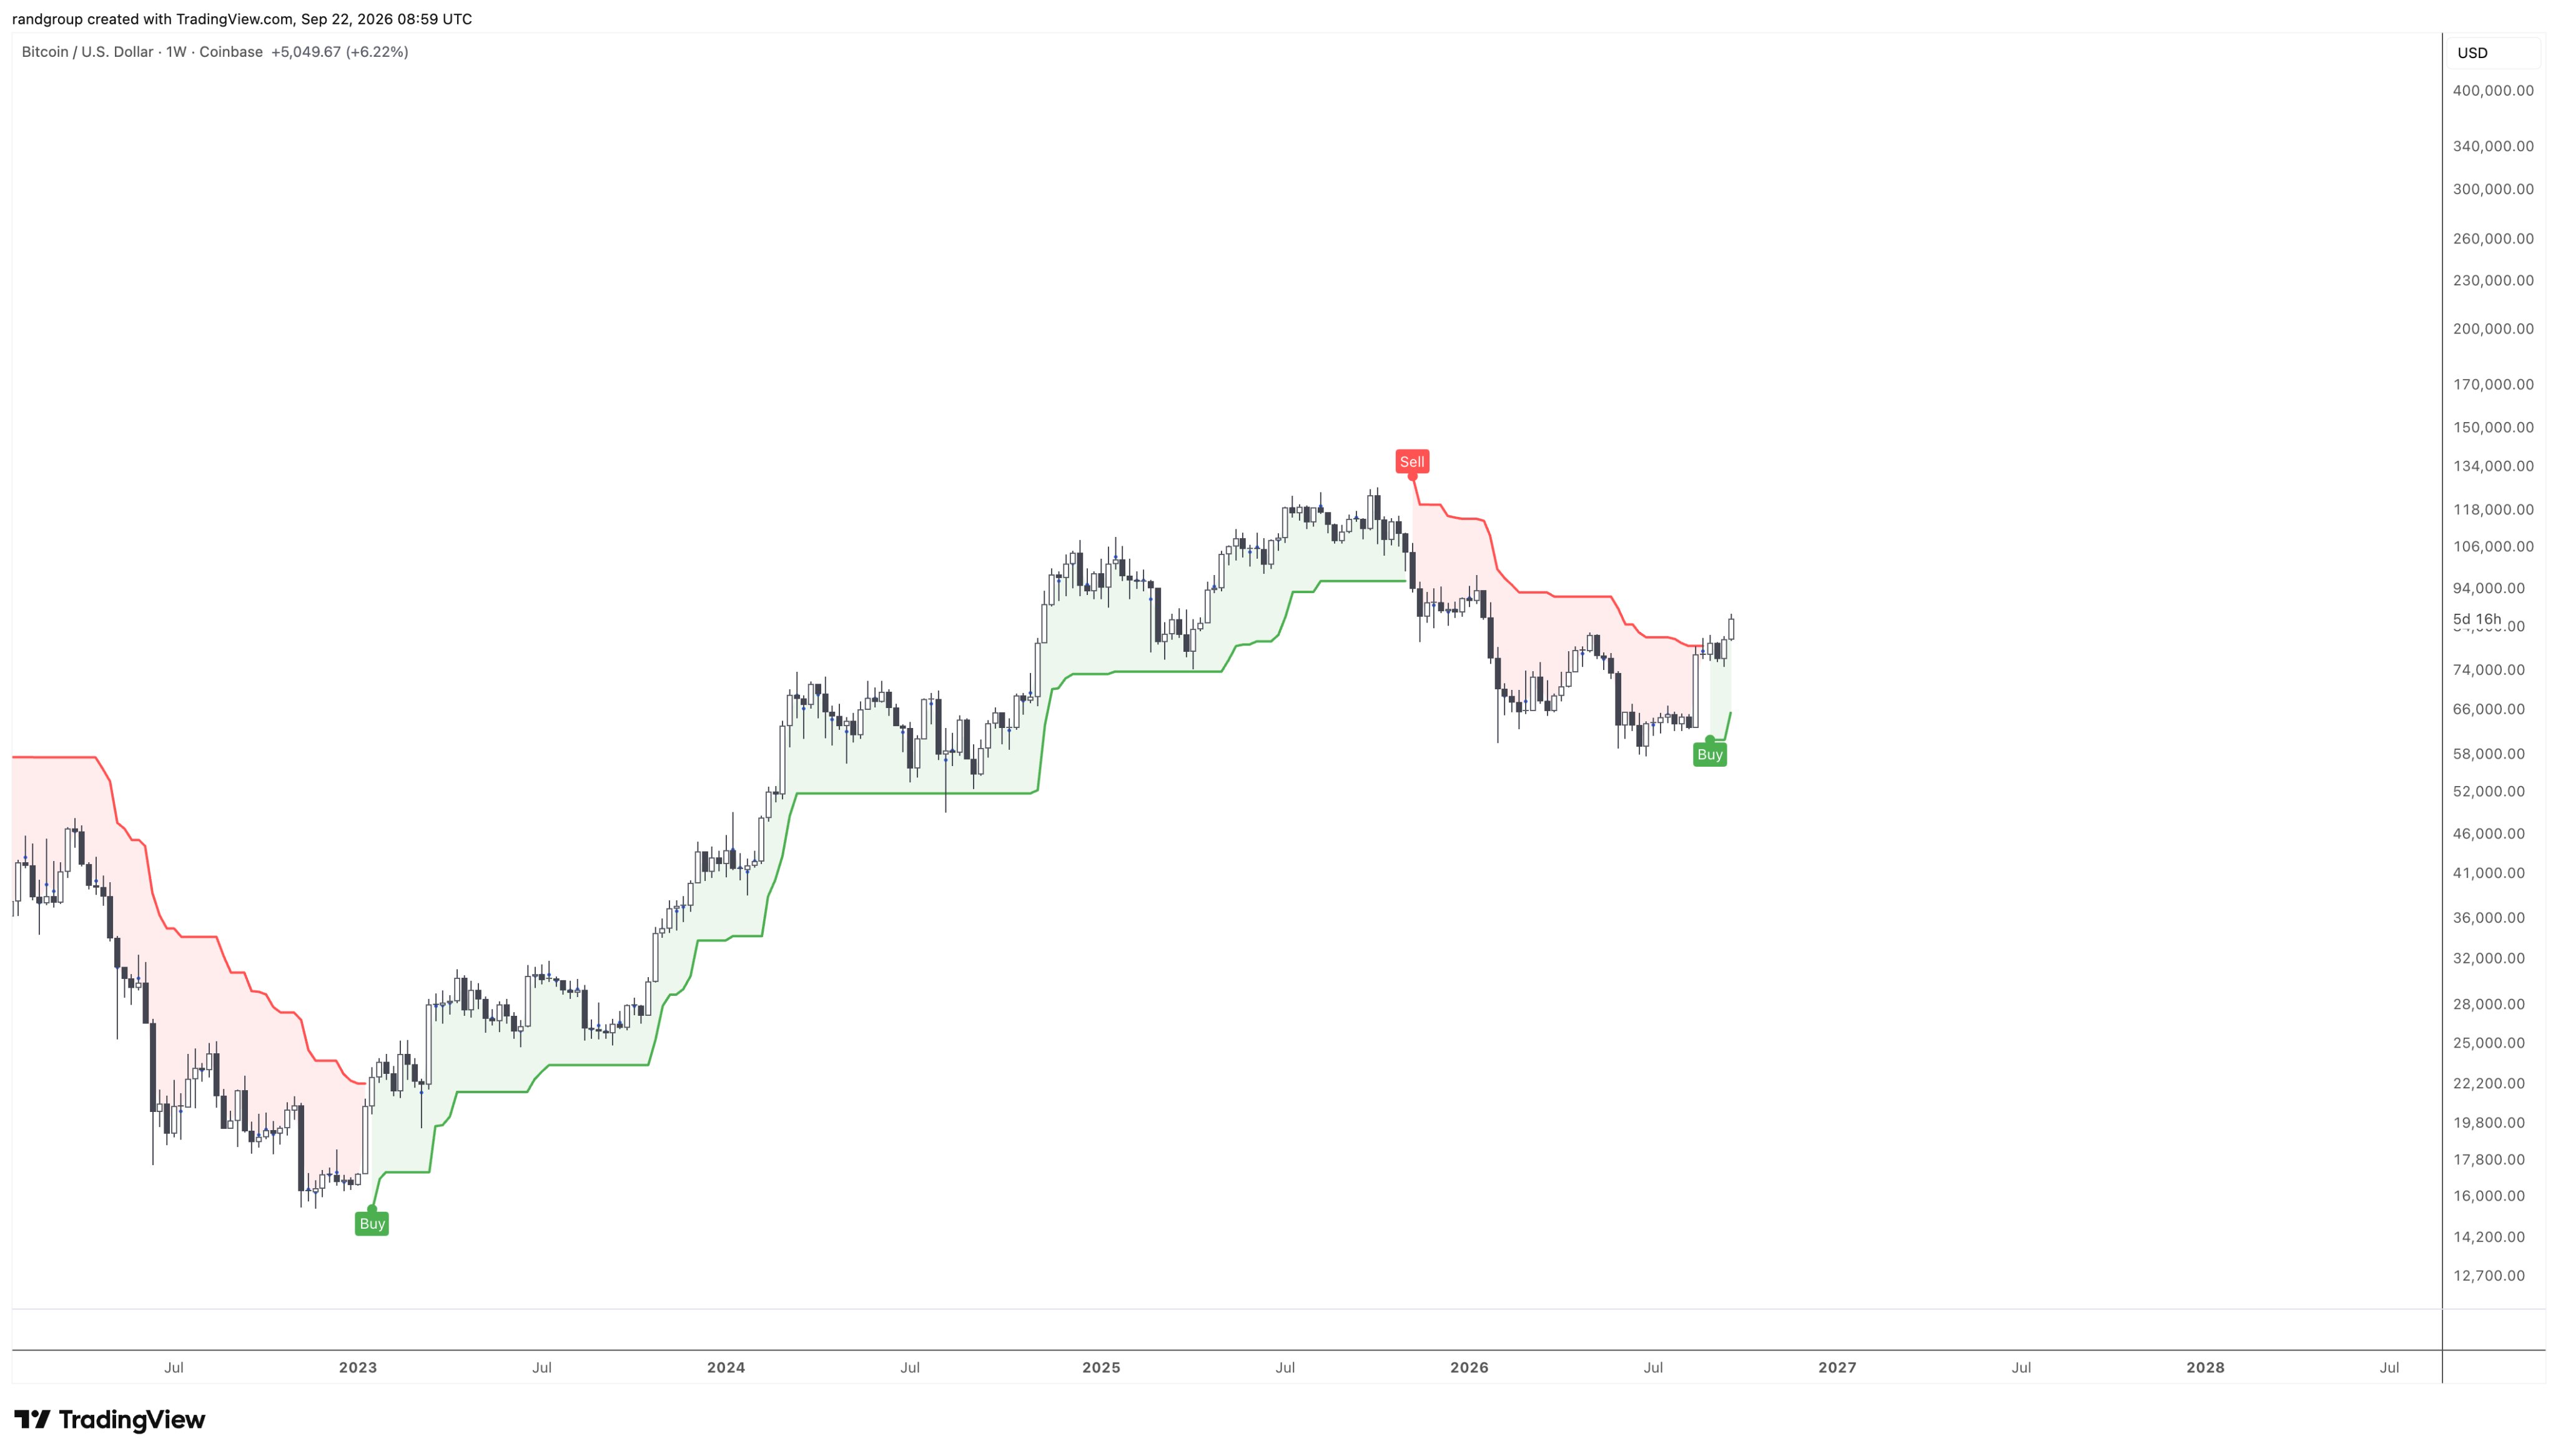
Bitcoin has received a new buy signal from the Supertrend indicator. Crypto commentator Rand Group noted that the indicator has turned green again, this time around $84,000.
The last time it gave a buy signal, Bitcoin was trading around $16,000. According to Rand Group, the indicator stayed green for about three years while Bitcoin rose roughly 700%. With the Supertrend turning bullish again at around $84,000, hopes are rising for another mega price rally.
The last time the Supertrend flagged a BUY signal, Bitcoin was $16K.
It stayed green for 3 years and 700% straight up. It just printed again at $84K 👀 pic.twitter.com/N4dGxeXFSS
— Rand Group (@randgroup) September 22, 2026
Bitcoin Supertrend Points to Big $BTC Rally
The chart shows Bitcoin’s price alongside the Supertrend indicator. The indicator turned green in early 2023, when Bitcoin was trading around $16,000. Bitcoin then went on a prolonged rally, surpassing $100,000 in December 2024 and reaching around $120,000 by October 2025.
In other words, the green signal lasted roughly three years before turning into a sell signal. Meanwhile, Bitcoin fell from above $100,000 to around $57,700 in July 2026. Now, the Supertrend has turned green again, with Bitcoin trading around $84,000.
In simple terms, the indicator is showing another buy signal after previously turning green ahead of a major Bitcoin rally. So far, Bitcoin has surged 51% from its cycle low of $57,700 over the past two months.
What the New Signal Means for Bitcoin
The Supertrend is a tool that uses Bitcoin’s price and volatility to show the direction of the trend. Green usually means the trend is moving upward, while red usually means the trend is moving downward.
Bitcoin’s latest green signal suggests that the trend may be turning upward again after its recent decline. However, the previous 700% rise does not mean Bitcoin will repeat the same move. Regardless of the potential upside, the indicator suggests a return to an upward trend, but it does not guarantee another major rally.
End of Bear Market?
This week, Bitcoin moved back above its 365-day moving average, which is around $83,000. CryptoQuant founder Ki Young Ju said this was the signal traders were watching for the end of the bear market and for institutional FOMO to resume.
Analyst Ted Pillows also pointed to a higher weekly high and a move above the 50-week moving average as signs that $BTC’s bottom is already in.
Bitcoin’s next major technical level is around $88,761, its two-year moving average. Holding above this level could indicate stronger upward momentum.
Bitcoin’s September 20 weekly close at $81,159 was about 3% above its 50-week moving average and 24% above its 200-week moving average. It was the first close above the 50-week moving average in 45 weeks.
Historically, Bitcoin’s recovery above its 50-week moving average has often been followed by further gains.
Leave a Reply
You must be logged in to post a comment.