Bitcoin is staging a modest rebound after last week’s sharp selloff, with analysts pointing to short-term traders as the main drivers of the correction while long-term holders continue to sit tight.
- Bitcoin price corrected 12% from its $124,000 peak, driven mainly by short-term profit-taking.
- Long-term holders avoided large selling, signaling confidence in the bull market.
- Analysts view the pullback as a normal reset, not a deeper trend reversal.
Bitcoin (BTC) is showing signs of recovery after a sharp pullback last week. The world’s largest cryptocurrency traded at $110,165 at press time, up 1.8% on the day, after bouncing from an intraday low of around $108,000. Prices remain 11% below the all-time high of $124,128 set on Aug. 14.
Bitcoin short-term sellers drove the drop
A Sept. 2 analysis from CryptoQuant contributor Arab Chain highlighted that short-term traders were the main force behind August’s correction. Every time speculators tried to push above $120,000, there was a surge in profit-taking, which led to brief spikes in selling pressure, according to data from Binance.
Despite high demand elsewhere, this kept Bitcoin capped below resistance. In contrast, long-term investors avoided large-scale selling.
According to the analysis, their conviction in the ongoing bull market remains intact, with selling ratios among this group holding steady at weak levels. This dynamic implies that traders locking in profits after a record high played a larger role in the correction than panic exits.
The failure to break $124,000 also added psychological weight. Frustrated by constant rejection, short-term players quickly exit positions to preserve gains. Although this deepened the decline, the absence of significant long-term outflows provides confidence that the general upward trend is still in place.
Cycle context still points to a normal drawdown
Additional context was provided by CryptoQuant contributor Darkfost, who noted that the current 12% drawdown is still within typical ranges for this cycle. Since March 2024, the steepest correction has been -28%, with most retracements falling between 20–25%.
The most recent decline, on the other hand, seems to be minor and consistent with previous bull market patterns. These corrections often reset leverage, cool overheated sentiment, and create new entry points for long-term buyers, according to Darkfost.
Bitcoin price technical analysis
Looking at the daily chart, momentum indicators present a conflicting picture. The MACD is bearish, and the Relative Strength Index at 43 indicates neutrality. The majority of moving averages, such as the 10-, 20-, and 50-day EMAs, exhibit a sell bias.
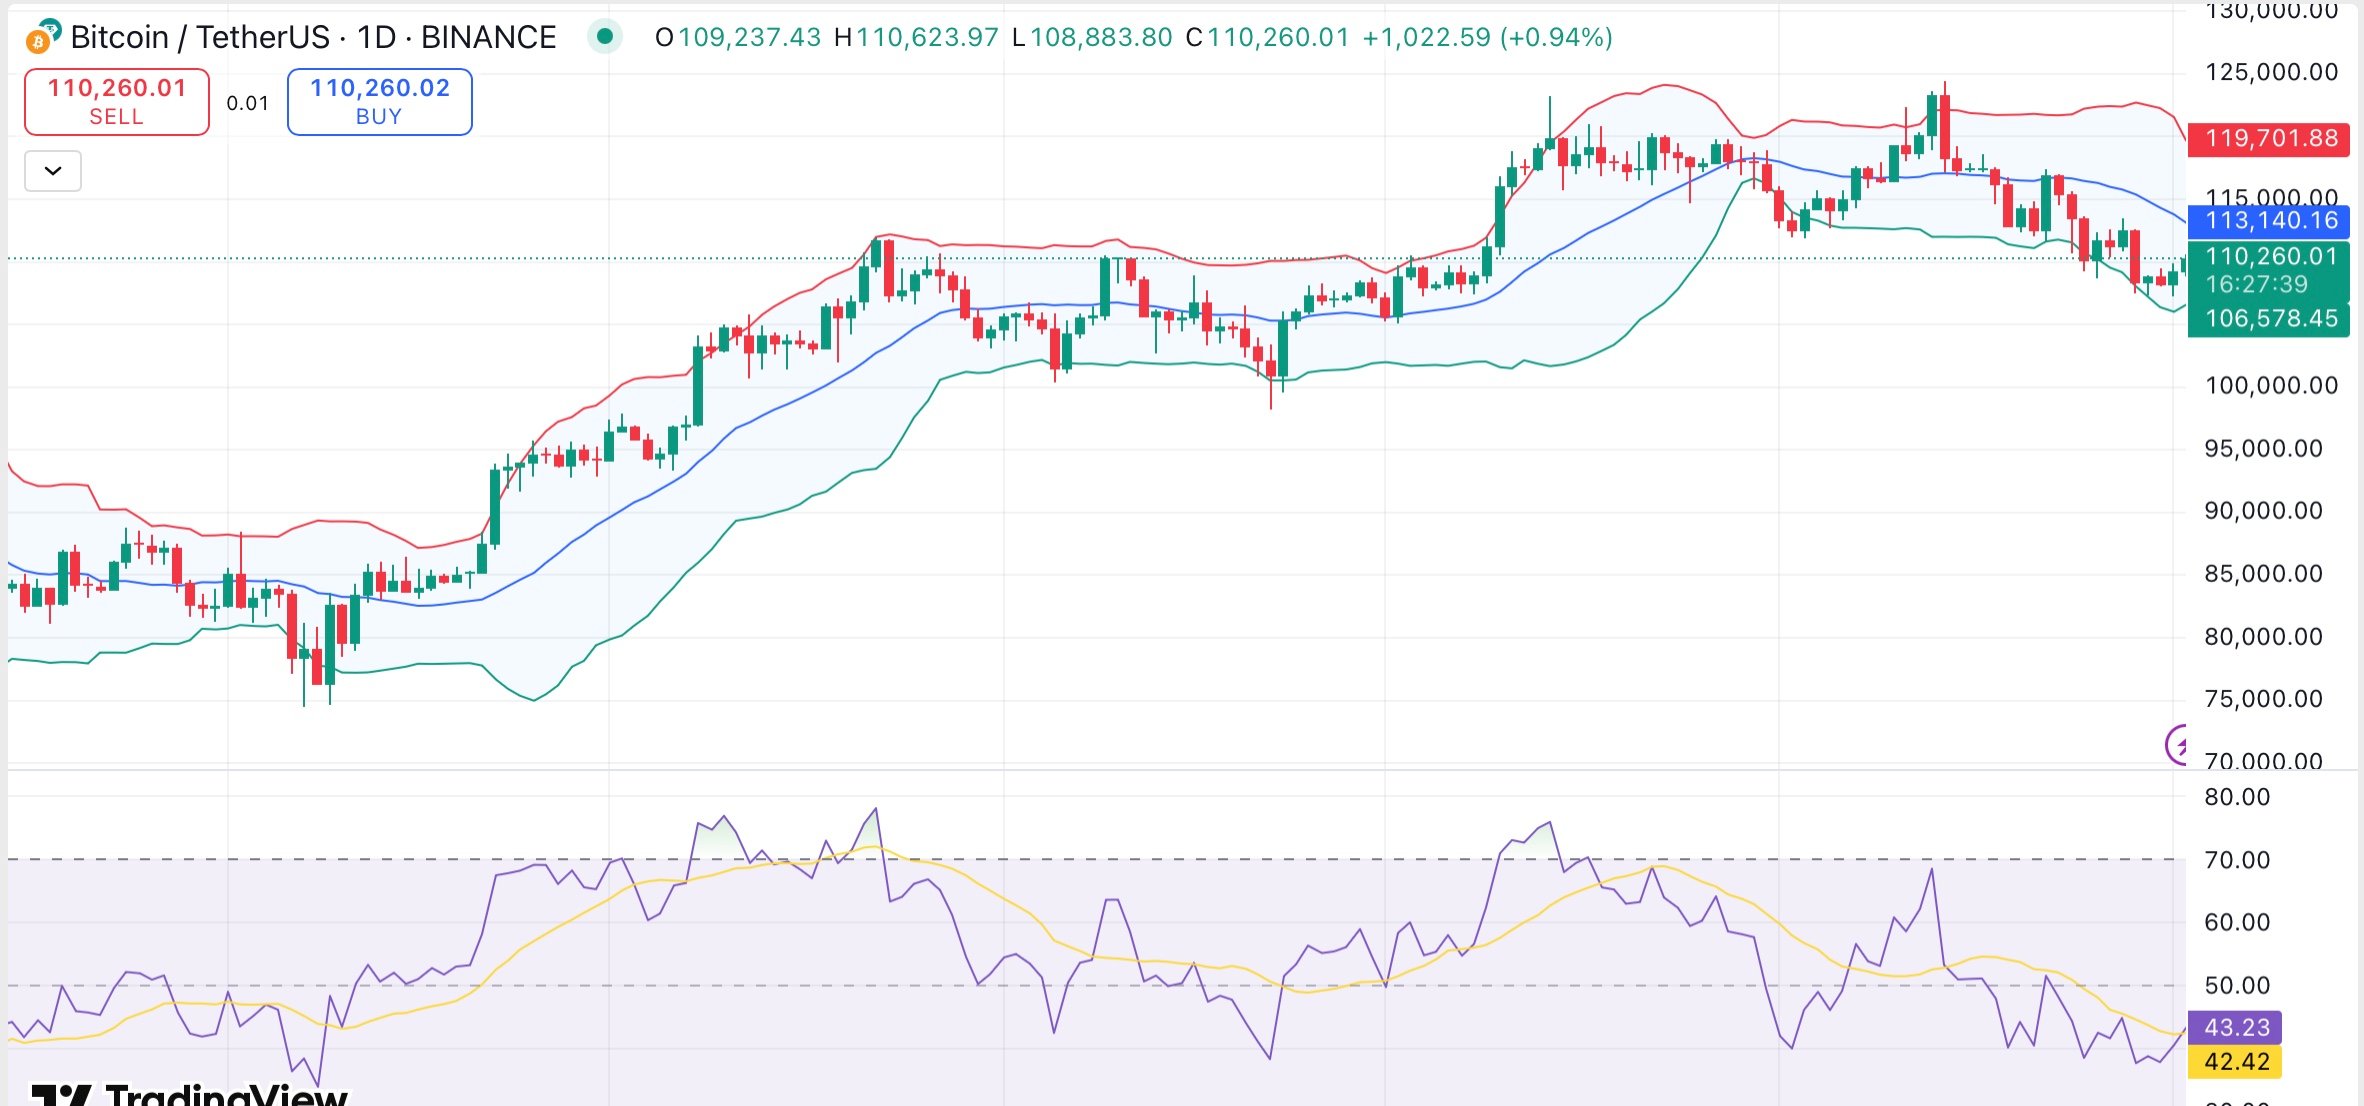
The longer-term 200-day averages, however, are still supportive and give a buy signal. This split reflects the tension between short-term selling pressure and the broader bullish structure.
A sustained hold above $110,000 could open the door back toward $115,000–$118,000, with a potential retest of $120,000 if momentum improves. If the $108,000 zone is not defended, prices could fall even lower, hitting $104,000, which is in line with the 200-day EMA support,