Bitcoin traded at $111,569 on Sept. 3, holding near resistance with a market cap of $2.22 trillion, 24-hour volume of $46.41 billion, and an intraday range between $108,538 and $111,653.
Bitcoin
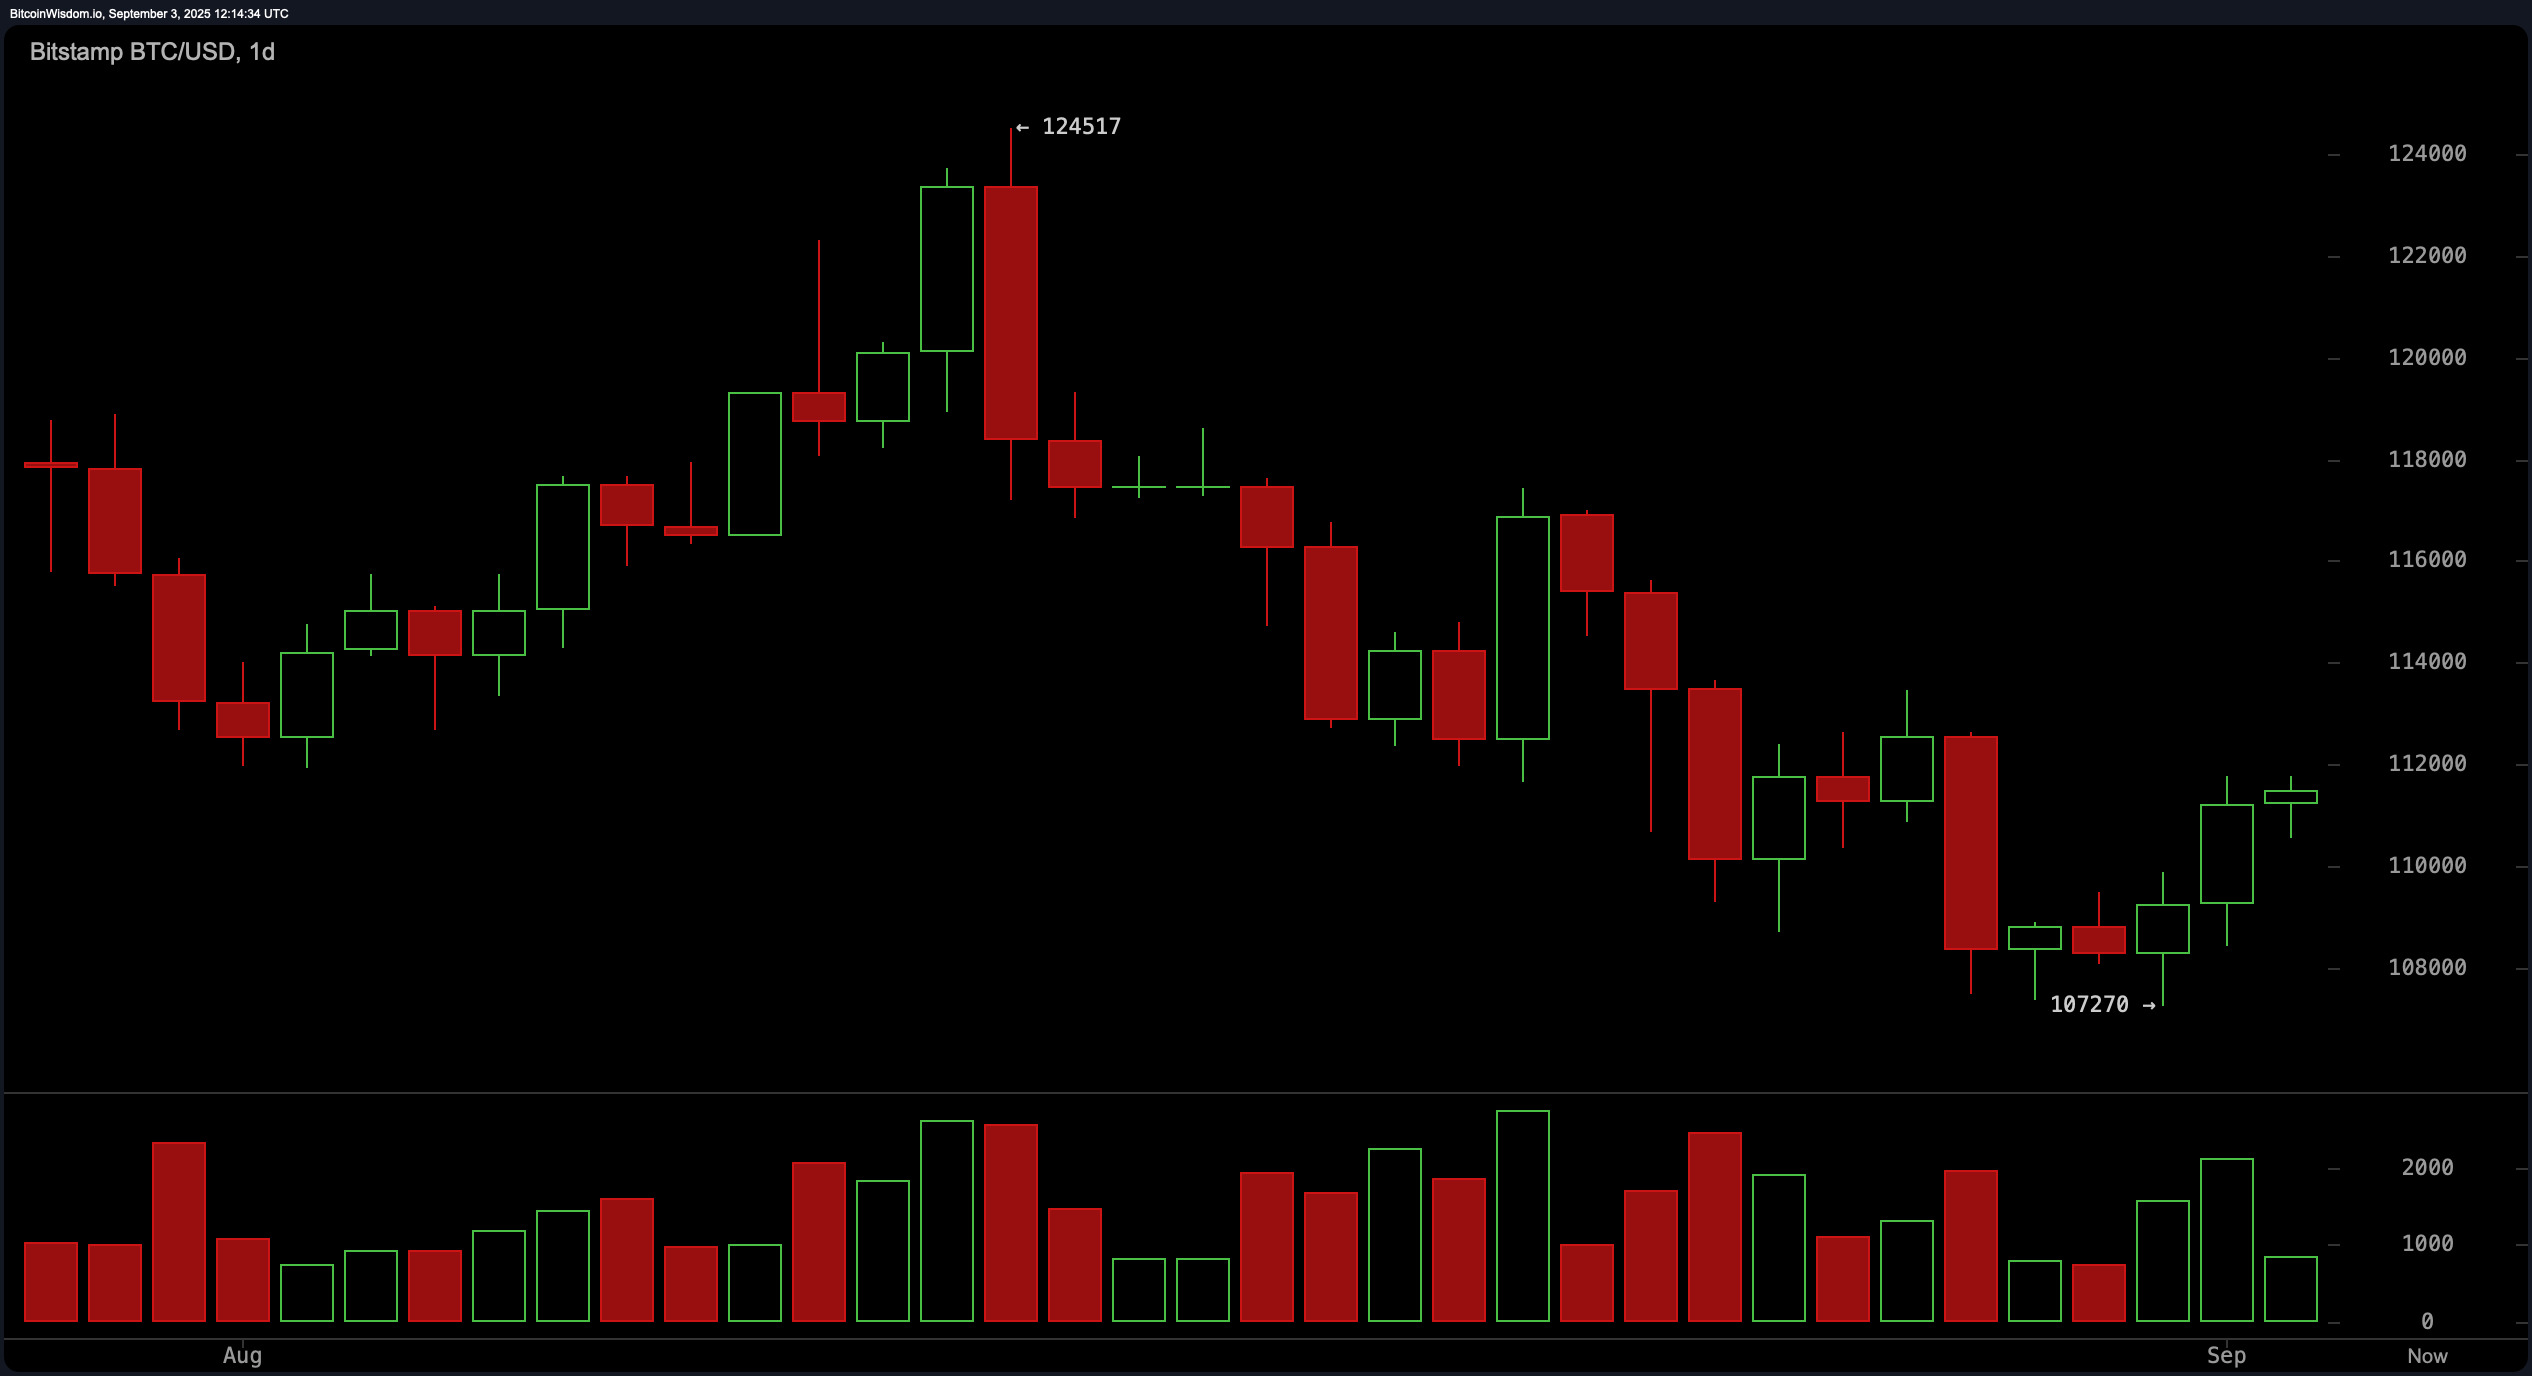
On the daily bitcoin chart, price action shows a sharp drop from roughly $124,000 to about $107,000, followed by a rebound that constitutes a short-term reversal. A clearly defined floor is cited near $107,270, while immediate resistance is concentrated in the $112,000–$114,000 band that has been tested multiple times. Volume characteristics are mixed, with the selloff occurring on higher turnover and the bounce on lighter activity, underscoring tentative bullish conviction. For swing traders, the file flags a prospective buy zone on a retest of $107,000–$108,000 and a likely exit band around $114,000–$116,000.
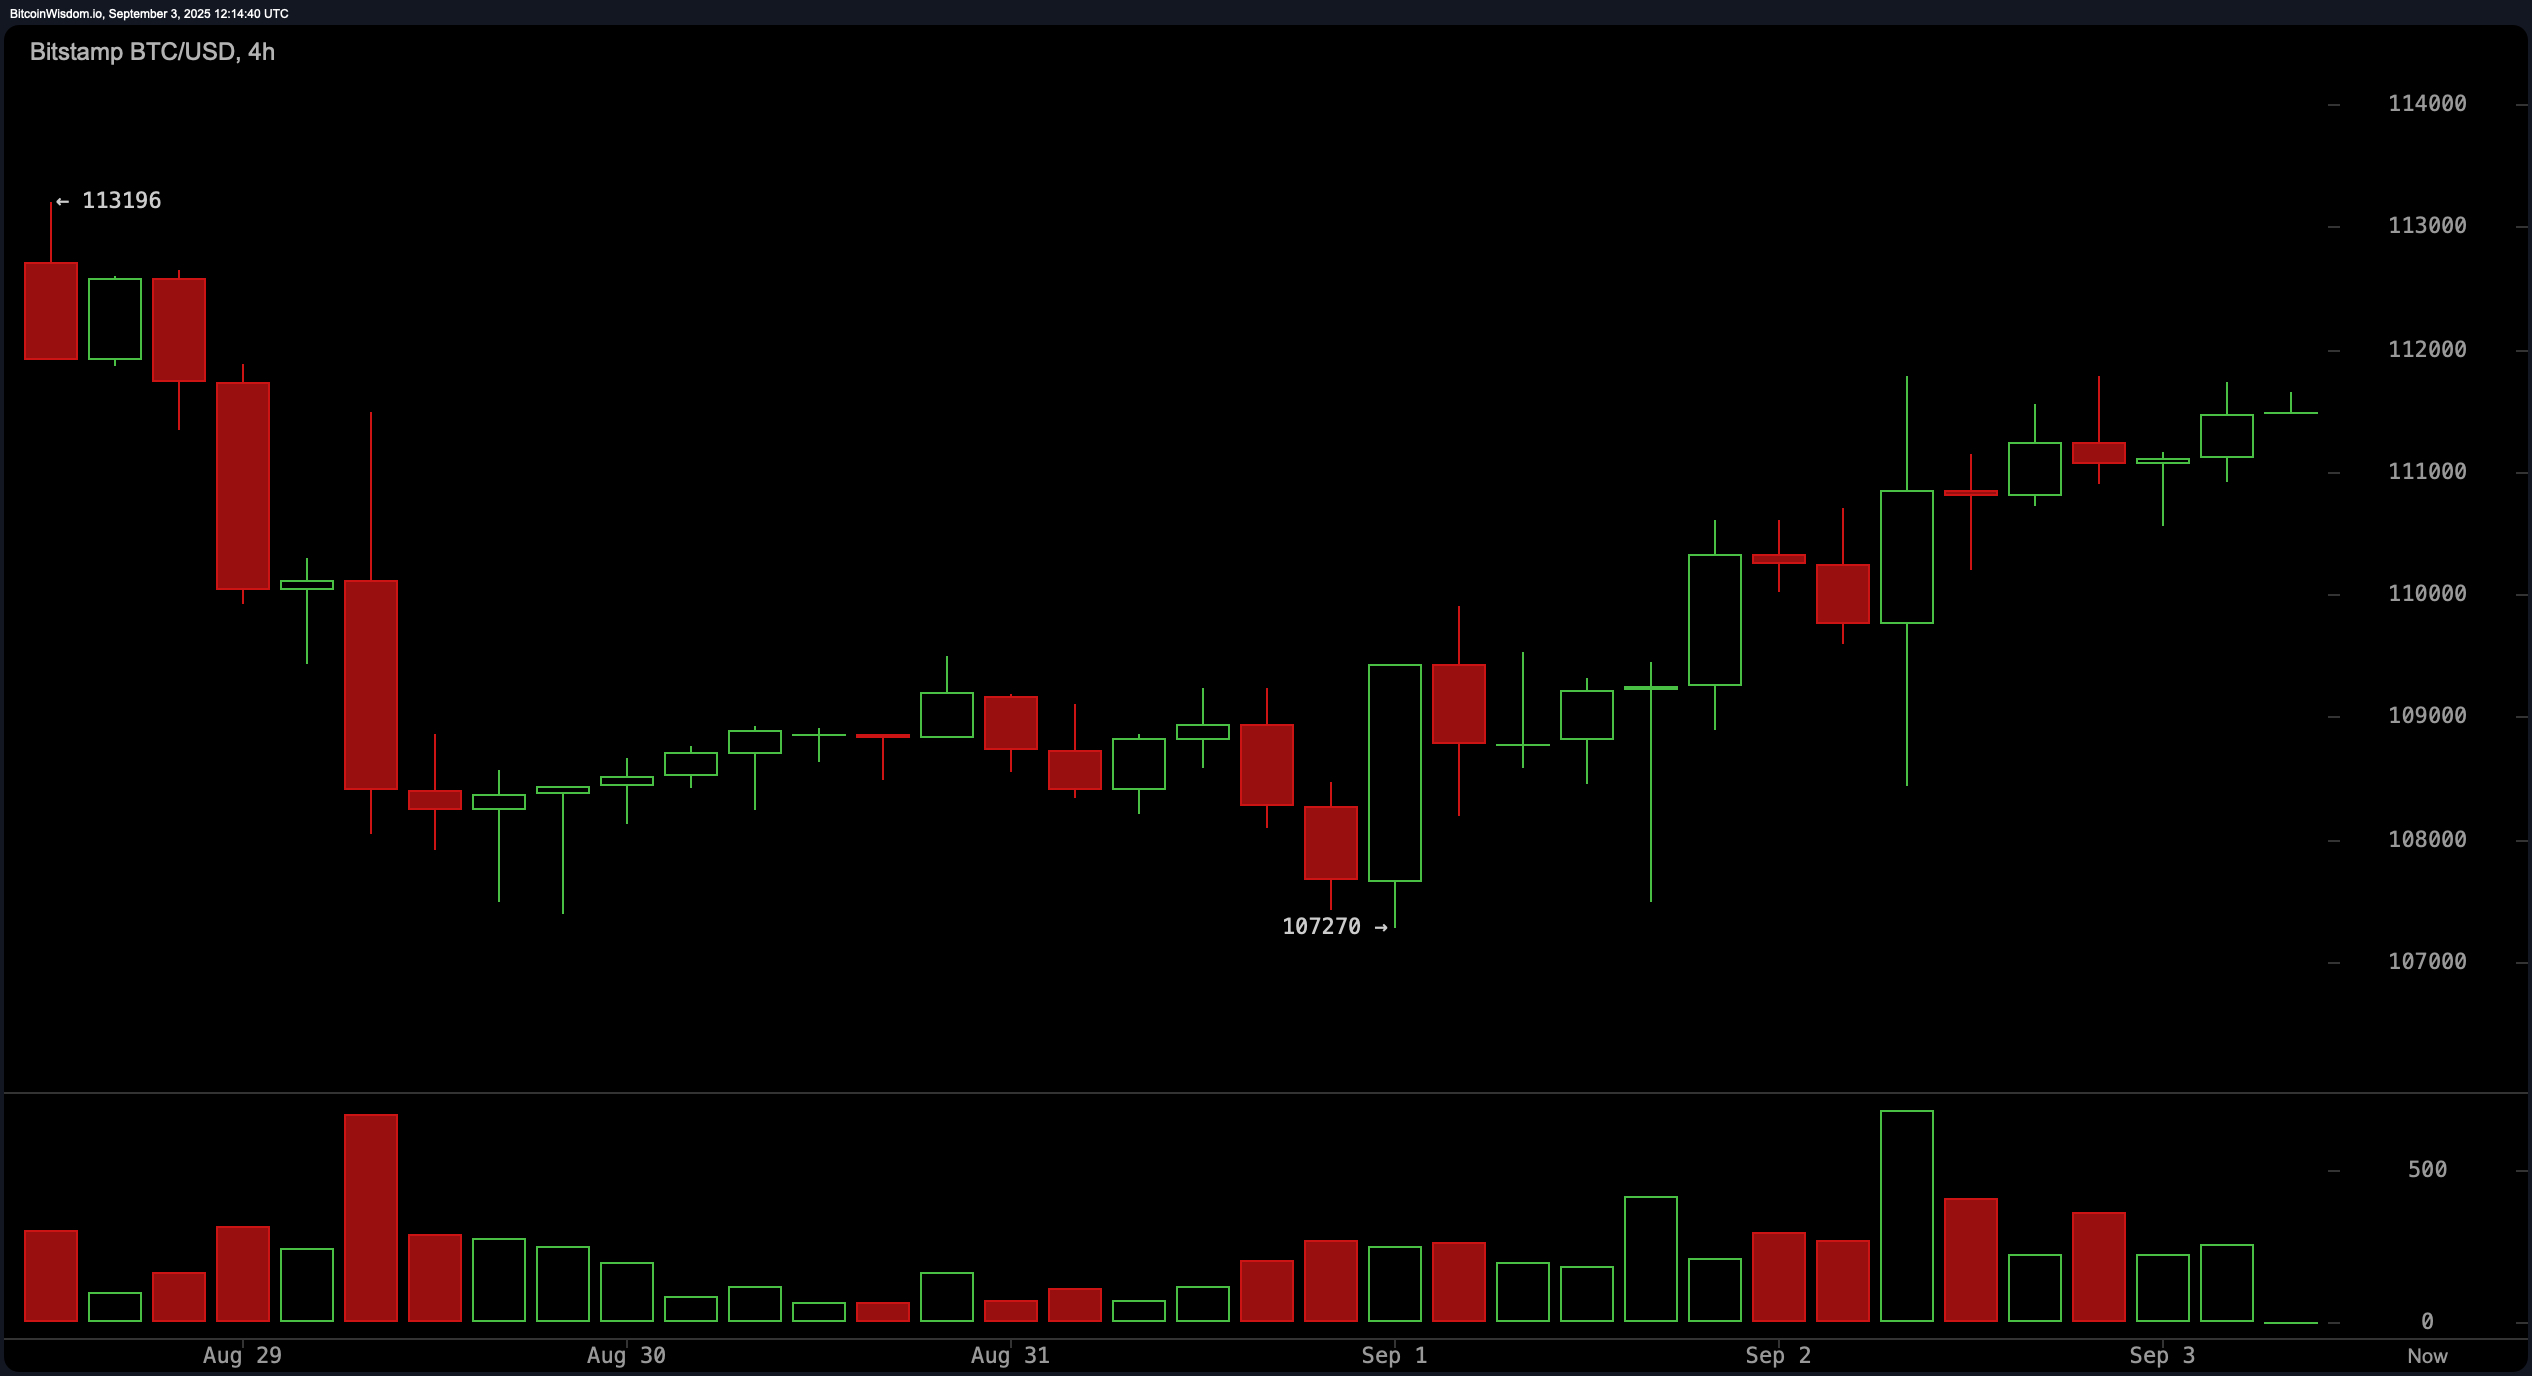
On bitcoin’s 4-hour chart view, the trend has been constructive off the $107,000 low, with higher lows forming as candles grind upward, though the advance lacks emphatic volume confirmation. Overhead, price is pinned beneath a $112,000–$113,000 supply zone. The playbook notes that a break and close above $112,000 on volume could extend toward $114,000, with prudent profit-taking framed near $114,000–$115,000 unless momentum accelerates.
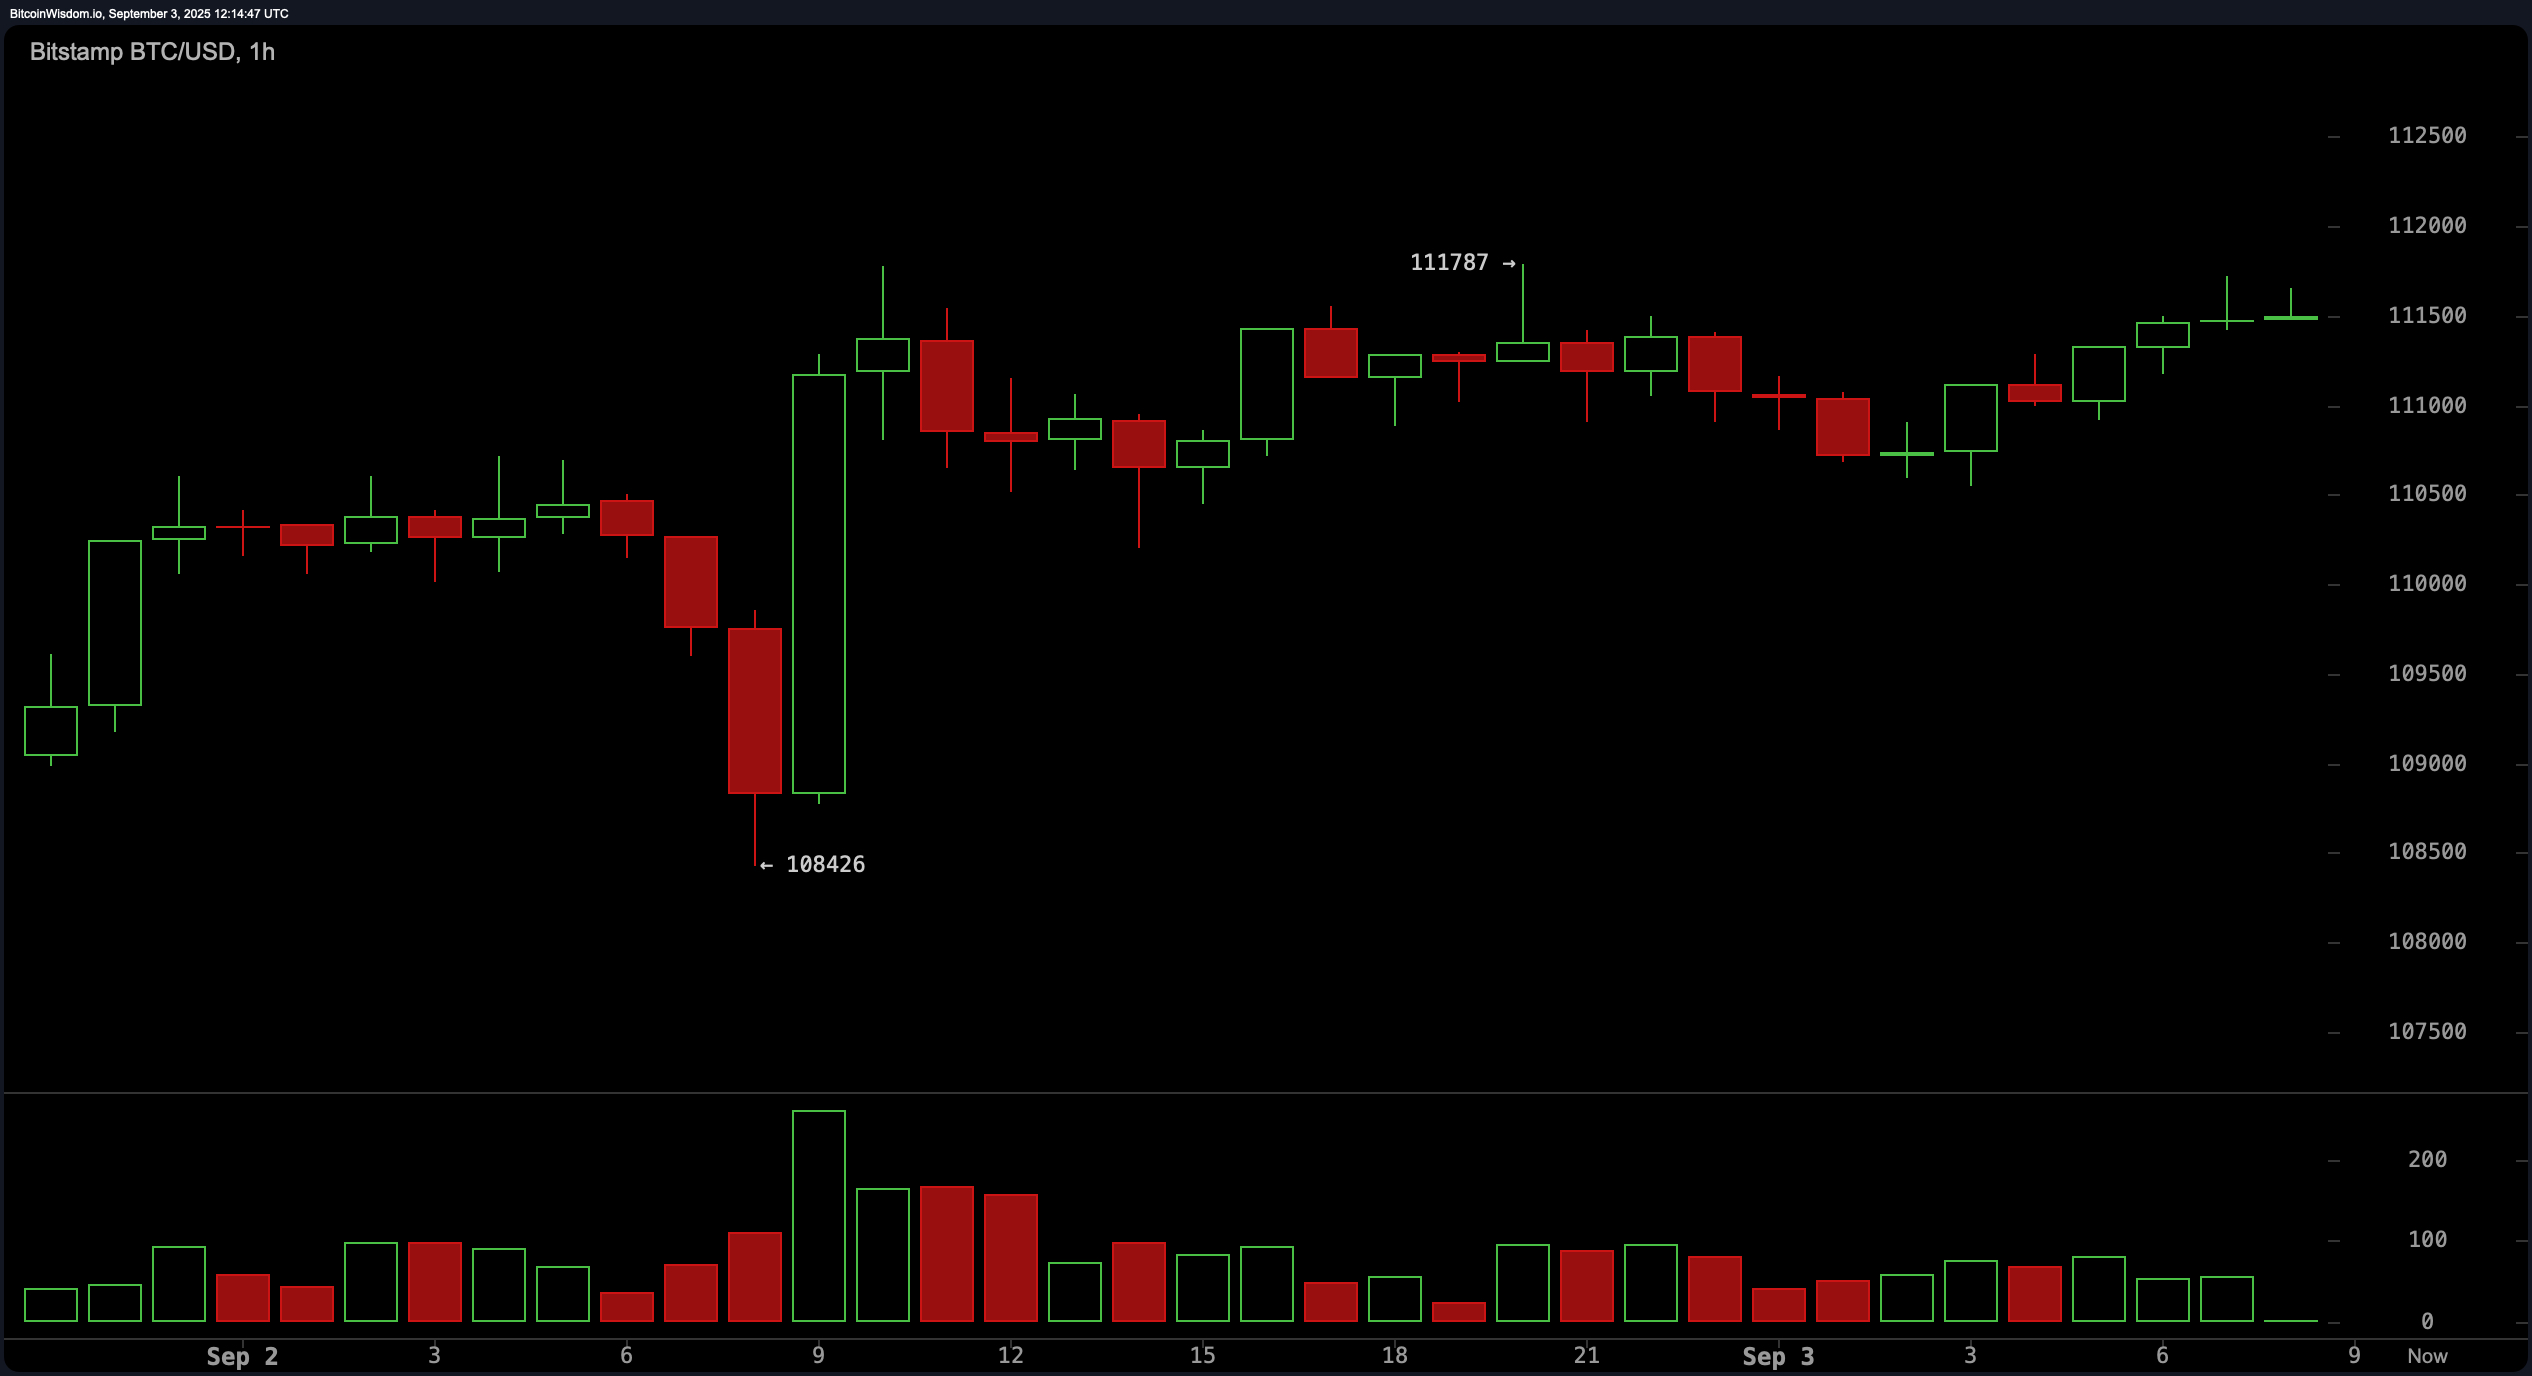
On the 1-hour chart, bitcoin dipped to $108,426 before bouncing and consolidating above $111,000 in what resembles a slow ascending channel or range ahead of a potential breakout. Short-term momentum improves when green candles print, suggesting buyers are pressing intraday. The setup calls for entries if $111,000 holds and a breakout prints near $111,500–$112,000 with volume, with risk defined below $110,000 and upside targets clustered in the $113,000–$114,000 zone.
Oscillators are largely non-committal: relative strength index (RSI) at 46, neutral; Stochastic oscillator at 33, neutral; commodity channel index (CCI) at −41, neutral; average directional index (ADX) at 20, neutral; awesome oscillator (AO) at −5,079, neutral. Two standouts diverge—momentum (MOM) prints −1,936 with a bullish signal, while moving average convergence divergence (MACD) level sits at −1,670 with a bearish signal—capturing the tug-of-war at resistance.
Moving averages (MAs) present a mixed, time-sensitive map. Shorter baselines lean supportive with exponential moving average (EMA) (10) at $110,982, bullish, and simple moving average (SMA) (10) at $110,324, bullish, but the next waves tilt defensive—EMA (20) at $112,387, bearish; SMA (20) at $112,863, bearish; EMA (30) at $113,205, bearish; SMA (30) at $114,566, bearish. Midcurve readings echo caution—EMA (50) at $113,390, bearish; SMA (50) at $115,651, bearish—while longer filters improve: EMA (100) at $110,754, bullish; SMA (100) at $111,746, sell; EMA (200) at $104,266, bullish; and SMA (200) at $101,466, bullish.
In sum, the file’s multitimeframe read underscores a market pressing into well-known supply with hesitant breadth: macro resistance stands at $112,000–$114,000, the 4-hour demands a volume-backed close above $112,000 to sustain a push, and intraday structure favors disciplined longs above $111,000 targeting $113,000–$114,000. A loss of $110,000–$108,000 would pivot focus back to $107,000 support; failure there could open a deeper corrective leg.
Bull Verdict:
If bitcoin maintains support above $111,000 and pushes through the $112,000–$114,000 resistance with volume, bulls could reclaim momentum toward $116,000 and potentially $120,000. Short-term moving averages and select momentum oscillators offer tactical support for continued upside in the near term.
Bear Verdict:
Should bitcoin fail to hold above $110,000 and slip back below $108,000, bearish pressure may drive price action toward the critical $107,000 floor—or lower. The dominance of sell signals across intermediate moving averages and a lack of conviction in volume could embolden sellers if resistance continues to reject.