
Bitcoin’s price on Sunday, July 13, 2025, hovers around $118,077, with a 24-hour market capitalization of $2.34 trillion and trading volume of $20.09 billion. The intraday range marked a tight band between $117,103 and $118,189, suggesting a day of consolidation at elevated levels near resistance.
Bitcoin
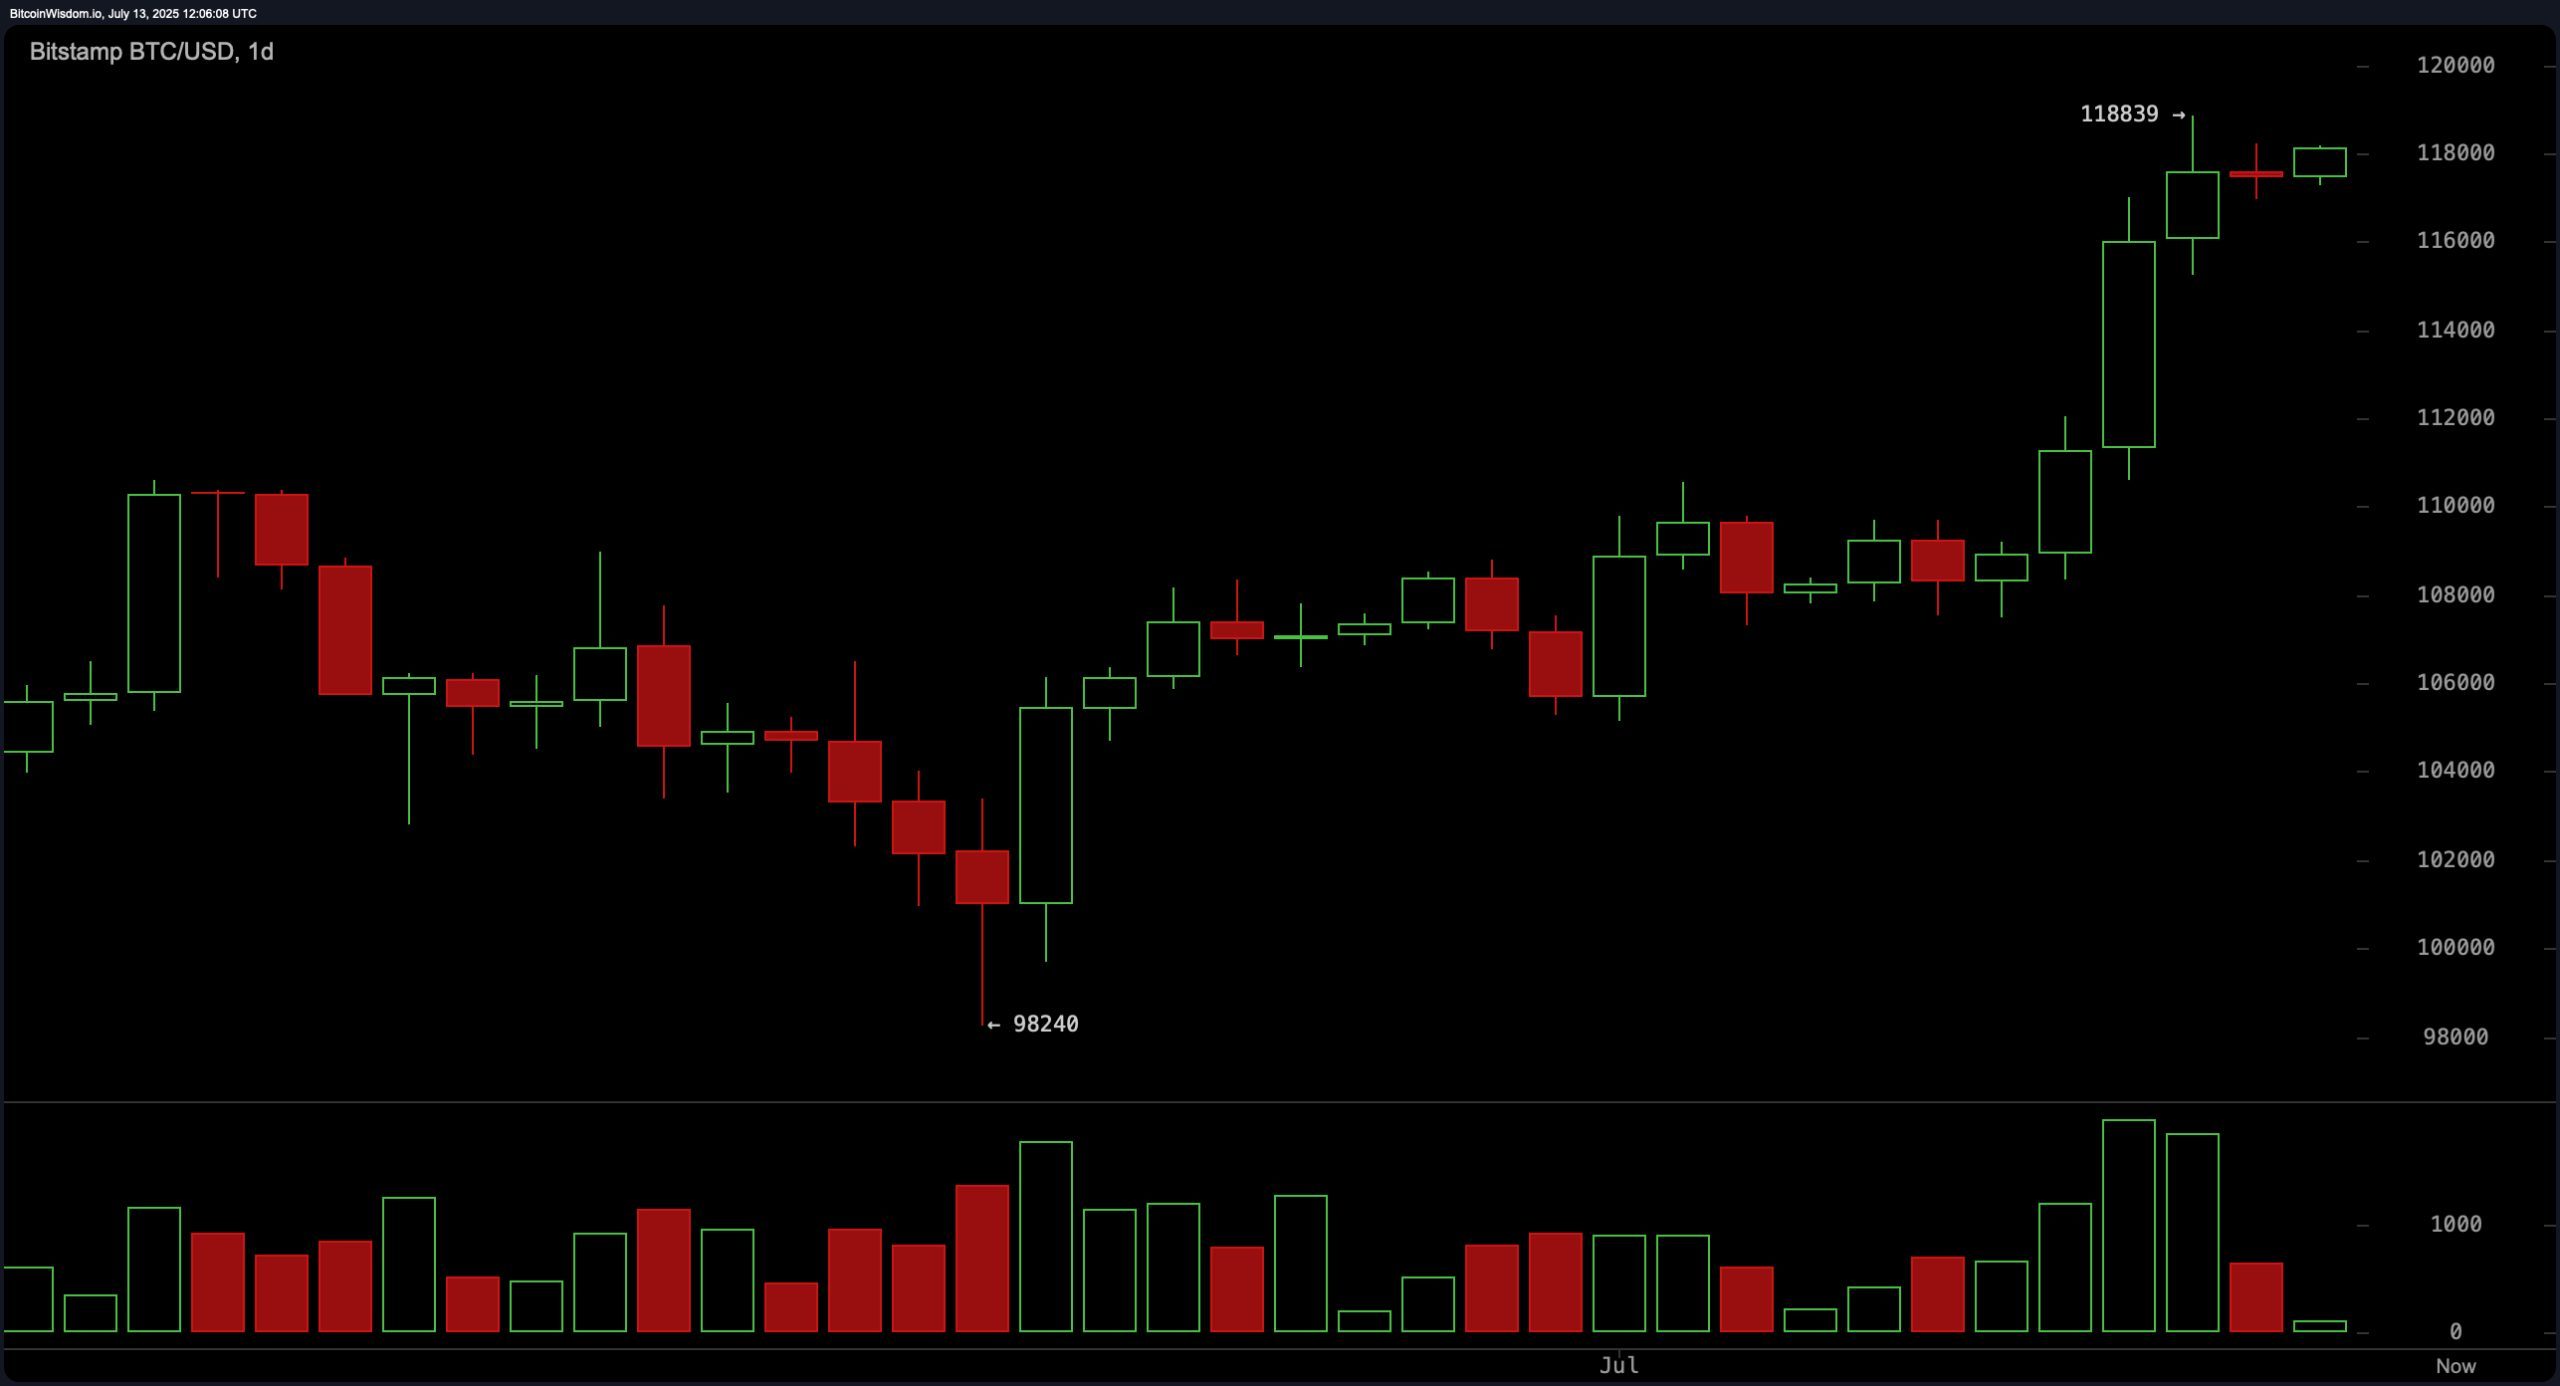
The daily BTC/USD chart reflects a clear bullish breakout from the $98,240 low, with the rally extending to $118,839 before stalling. This upward movement is underpinned by earlier rising volume, although recent bars indicate waning momentum, possibly pointing to a distribution phase. Price action is consolidating near the highs, and support has been reestablished at $110,000 and $106,000. A corrective move to the $110,000–$112,000 range may present a buy-the-dip opportunity if accompanied by a bullish reversal candle and volume expansion. Profit-taking is advisable near the $118,500–$119,000 zone, especially if bearish reversal patterns emerge.
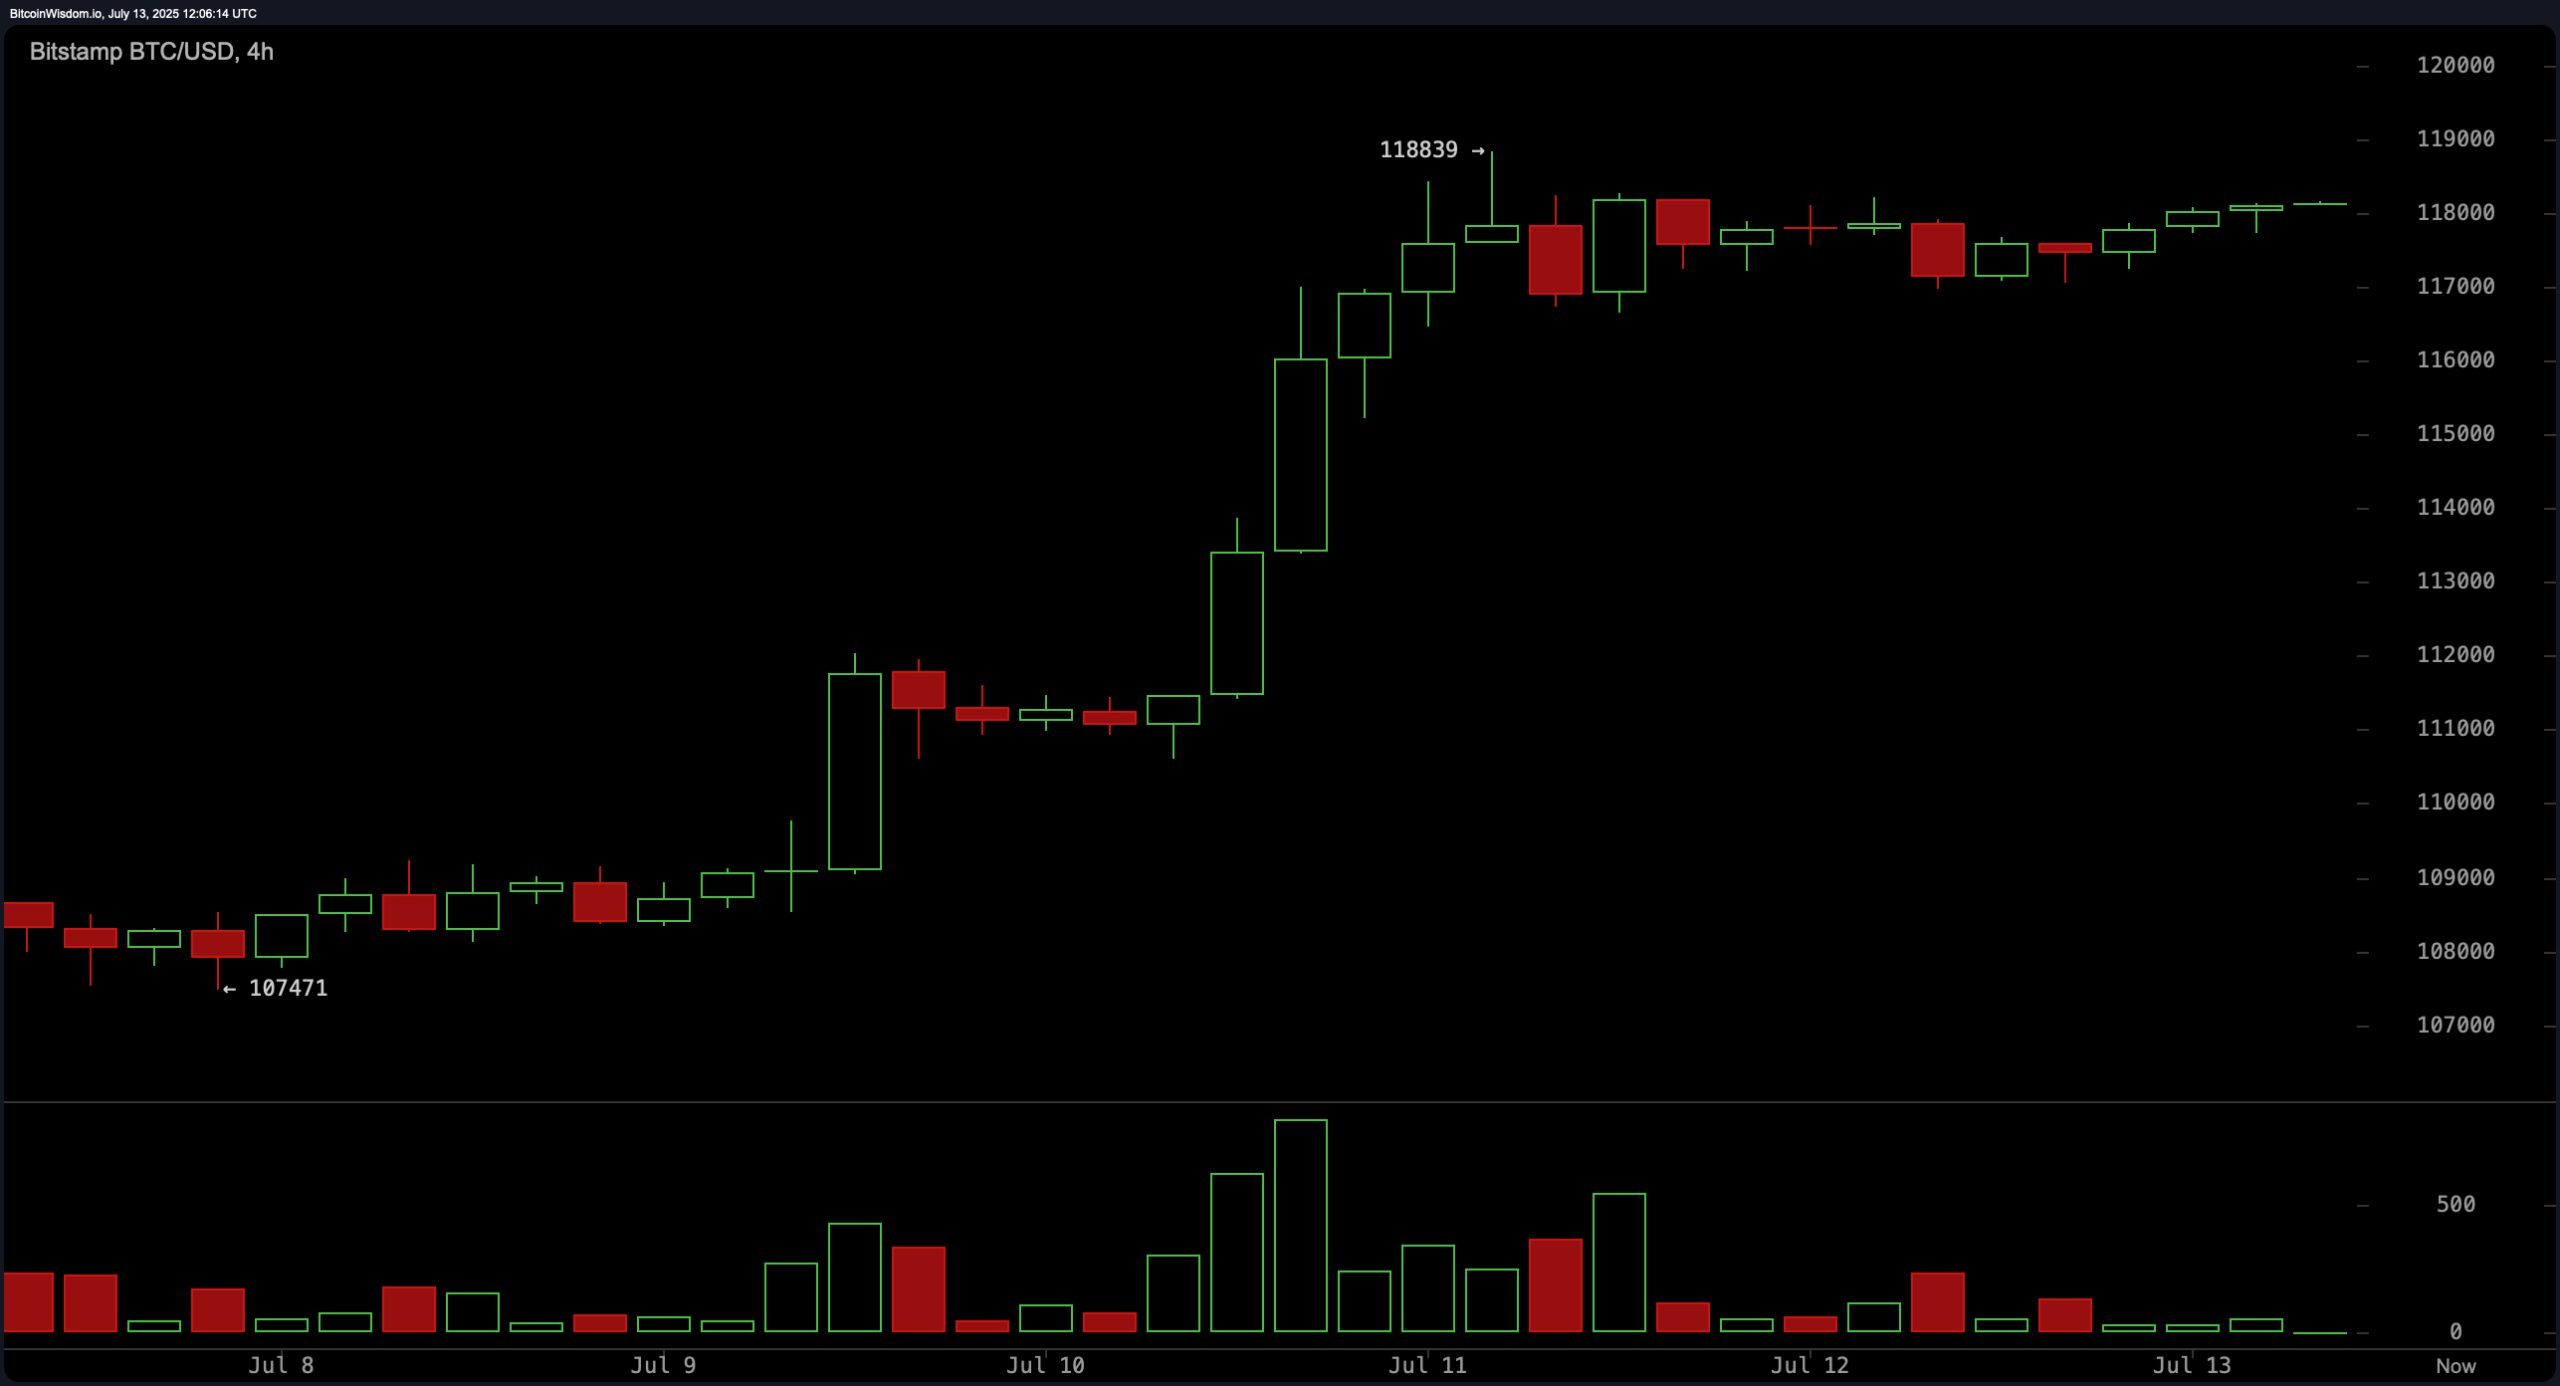
On the 4-hour chart, bitcoin shows a steep uptrend from around $107,500 to the $118,839 high, followed by lateral consolidation. The pattern formation resembles a bullish flag or ascending triangle, both of which signal potential for continuation. However, a break and close above $118,839 with a volume uptick would confirm the next leg higher toward $120,000 and beyond. Conversely, a close below $117,000 may trigger a pullback to $115,000, invalidating the short-term bullish thesis. The setup favors breakout traders prepared for quick decision-making.
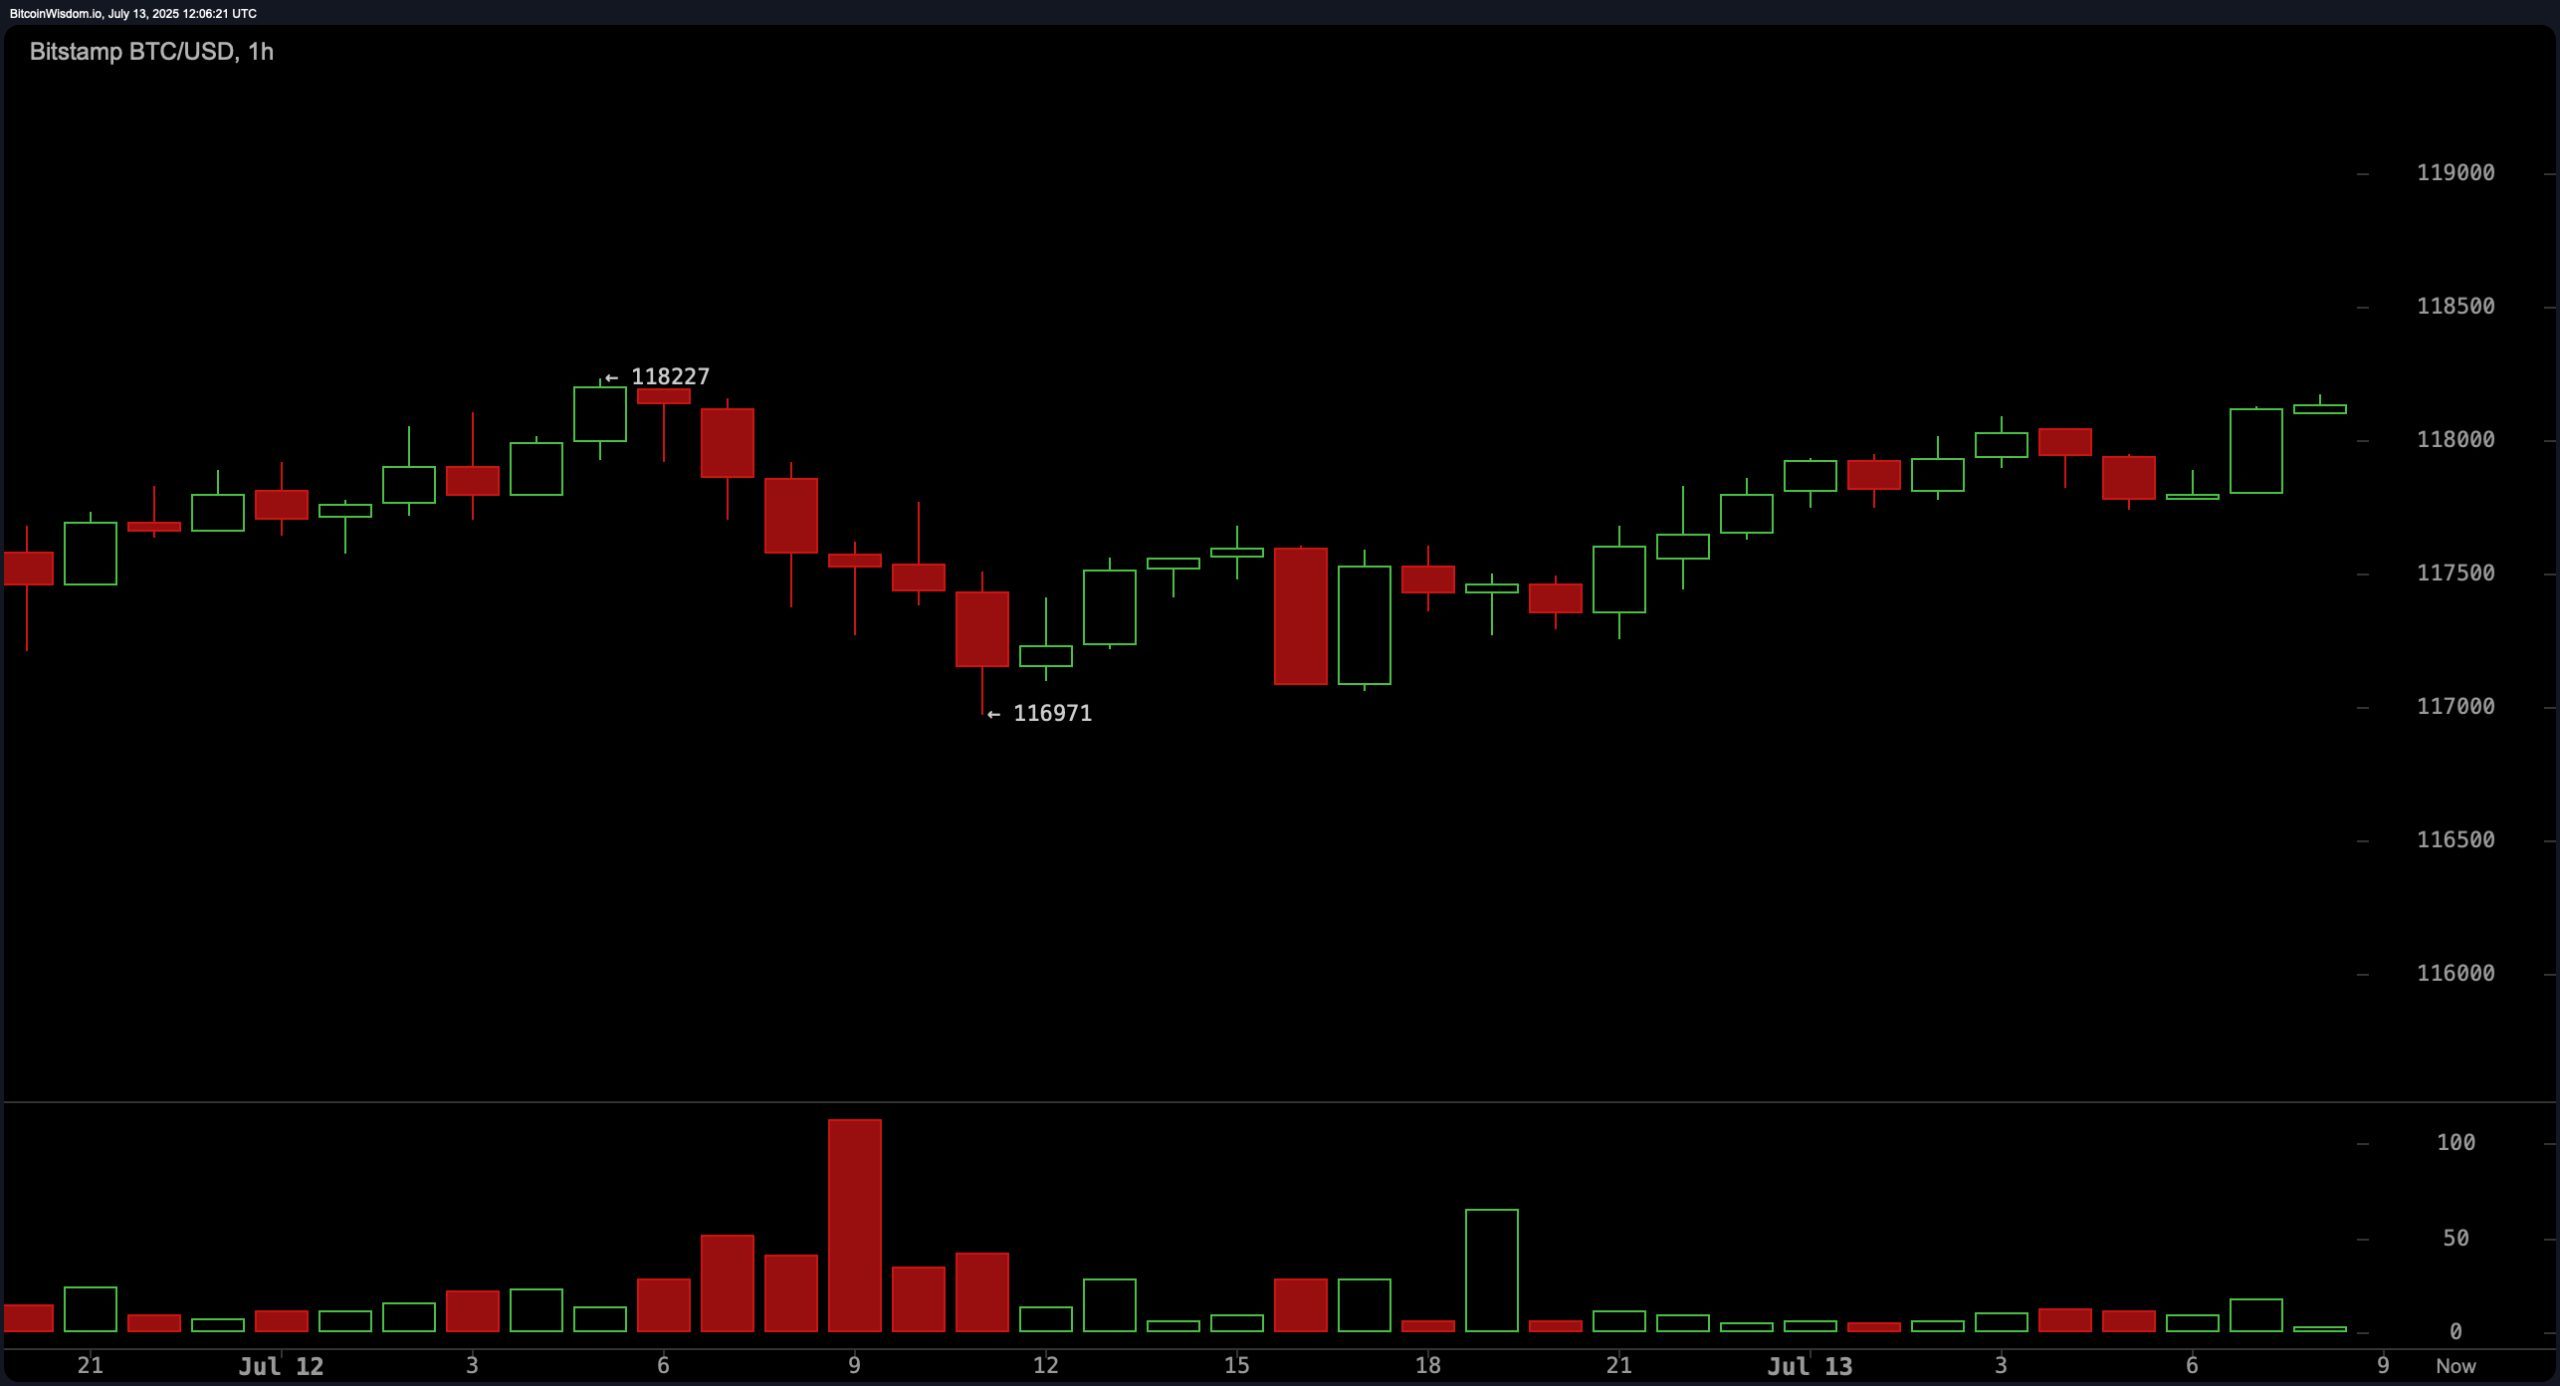
The 1-hour bitcoin chart reveals a minor double top near $118,200 and a reactive low of $116,971. Momentum has weakened, evidenced by price softness and decreasing volume. Key resistance lies between $118,200 and $118,800, while $117,000 serves as immediate support. A potential breakout above $118,200 with rising volume could justify a short-term long position, while a bullish bounce at $117,000 might offer an entry for scalpers. Traders should remain nimble, with tight stop-loss levels near $116,500 to manage downside risk effectively.
Oscillator readings present a mixed technical bias. The relative strength index (RSI) at 74, Stochastic at 92, and average directional index (ADX) at 20 all signal neutral momentum. The commodity channel index (CCI) at 186 and momentum (10) at 8,512 trigger bearish signals, pointing to near-term overextension. However, the moving average convergence divergence (MACD) level at 2,832 supports a bullish outlook. These mixed indicators imply that while the broader trend remains intact, short-term caution is warranted.
Moving averages (MAs) continue to reinforce the bullish trend across all timeframes. The exponential moving average (EMA) and simple moving average (SMA) from the 10-period to 200-period windows are all positioned below the current price, supporting the upside thesis. The EMA (10) at $113,545 and SMA (10) at $112,323 reflect strong near-term support. Long-term trend strength is confirmed with the EMA (200) at $96,660 and SMA (200) at $96,999, reinforcing that pullbacks to the $110,000 region could serve as high-probability reentry points for longer-horizon traders.
Bull Verdict:
Bitcoin remains technically resilient, with consistent support from all major moving averages and a bullish continuation structure forming on the 4-hour chart. A confirmed breakout above $118,839 backed by volume would likely trigger a new leg toward $120,000 and beyond, making this a favorable environment for momentum-driven long positions.
Bear Verdict:
Despite a dominant uptrend, short-term signals such as the commodity channel index (CCI) and momentum indicators warn of buyer exhaustion near resistance. If bitcoin fails to clear $118,839 and breaks below $117,000, it could lead to a corrective slide toward the $115,000–$110,000 zone, offering a tactical setup for short-term bearish trades.