Bitcoin has shifted out of its “trapped between MAs and resistance” phase into a confirmed breakout, with liquidity sweeps and structural shifts tilting the bias strongly bullish.
While short-term pullbacks remain possible, the market structure now favours continuation toward $120K–$124K, where the next significant supply block and sell-side liquidity cluster await.
Technical Analysis
By Shayan
The Daily Chart
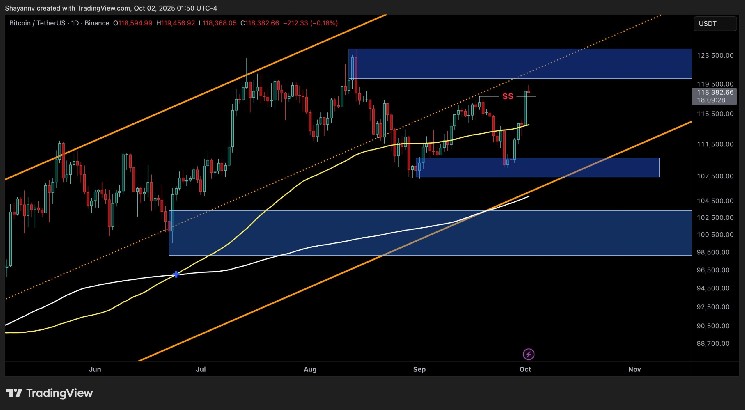
On the daily timeframe, BTC has reclaimed the 100-day MA ($114K) and surged through the midpoint of its consolidation range, pressing into the $118K zone just beneath the broader $120K–$124K supply block. This area coincides with a major order block from prior distribution, making it a critical level.
The surge confirms a bullish breakout from the recent major swing high, weakening the broader corrective structure. Although the daily candles show some rejection around $118K, the medium-term structure remains constructive. As long as BTC holds above the $112K–$114K zone — now turned into support — the path of least resistance points higher toward $120K–$124K.
The 4-Hour Chart
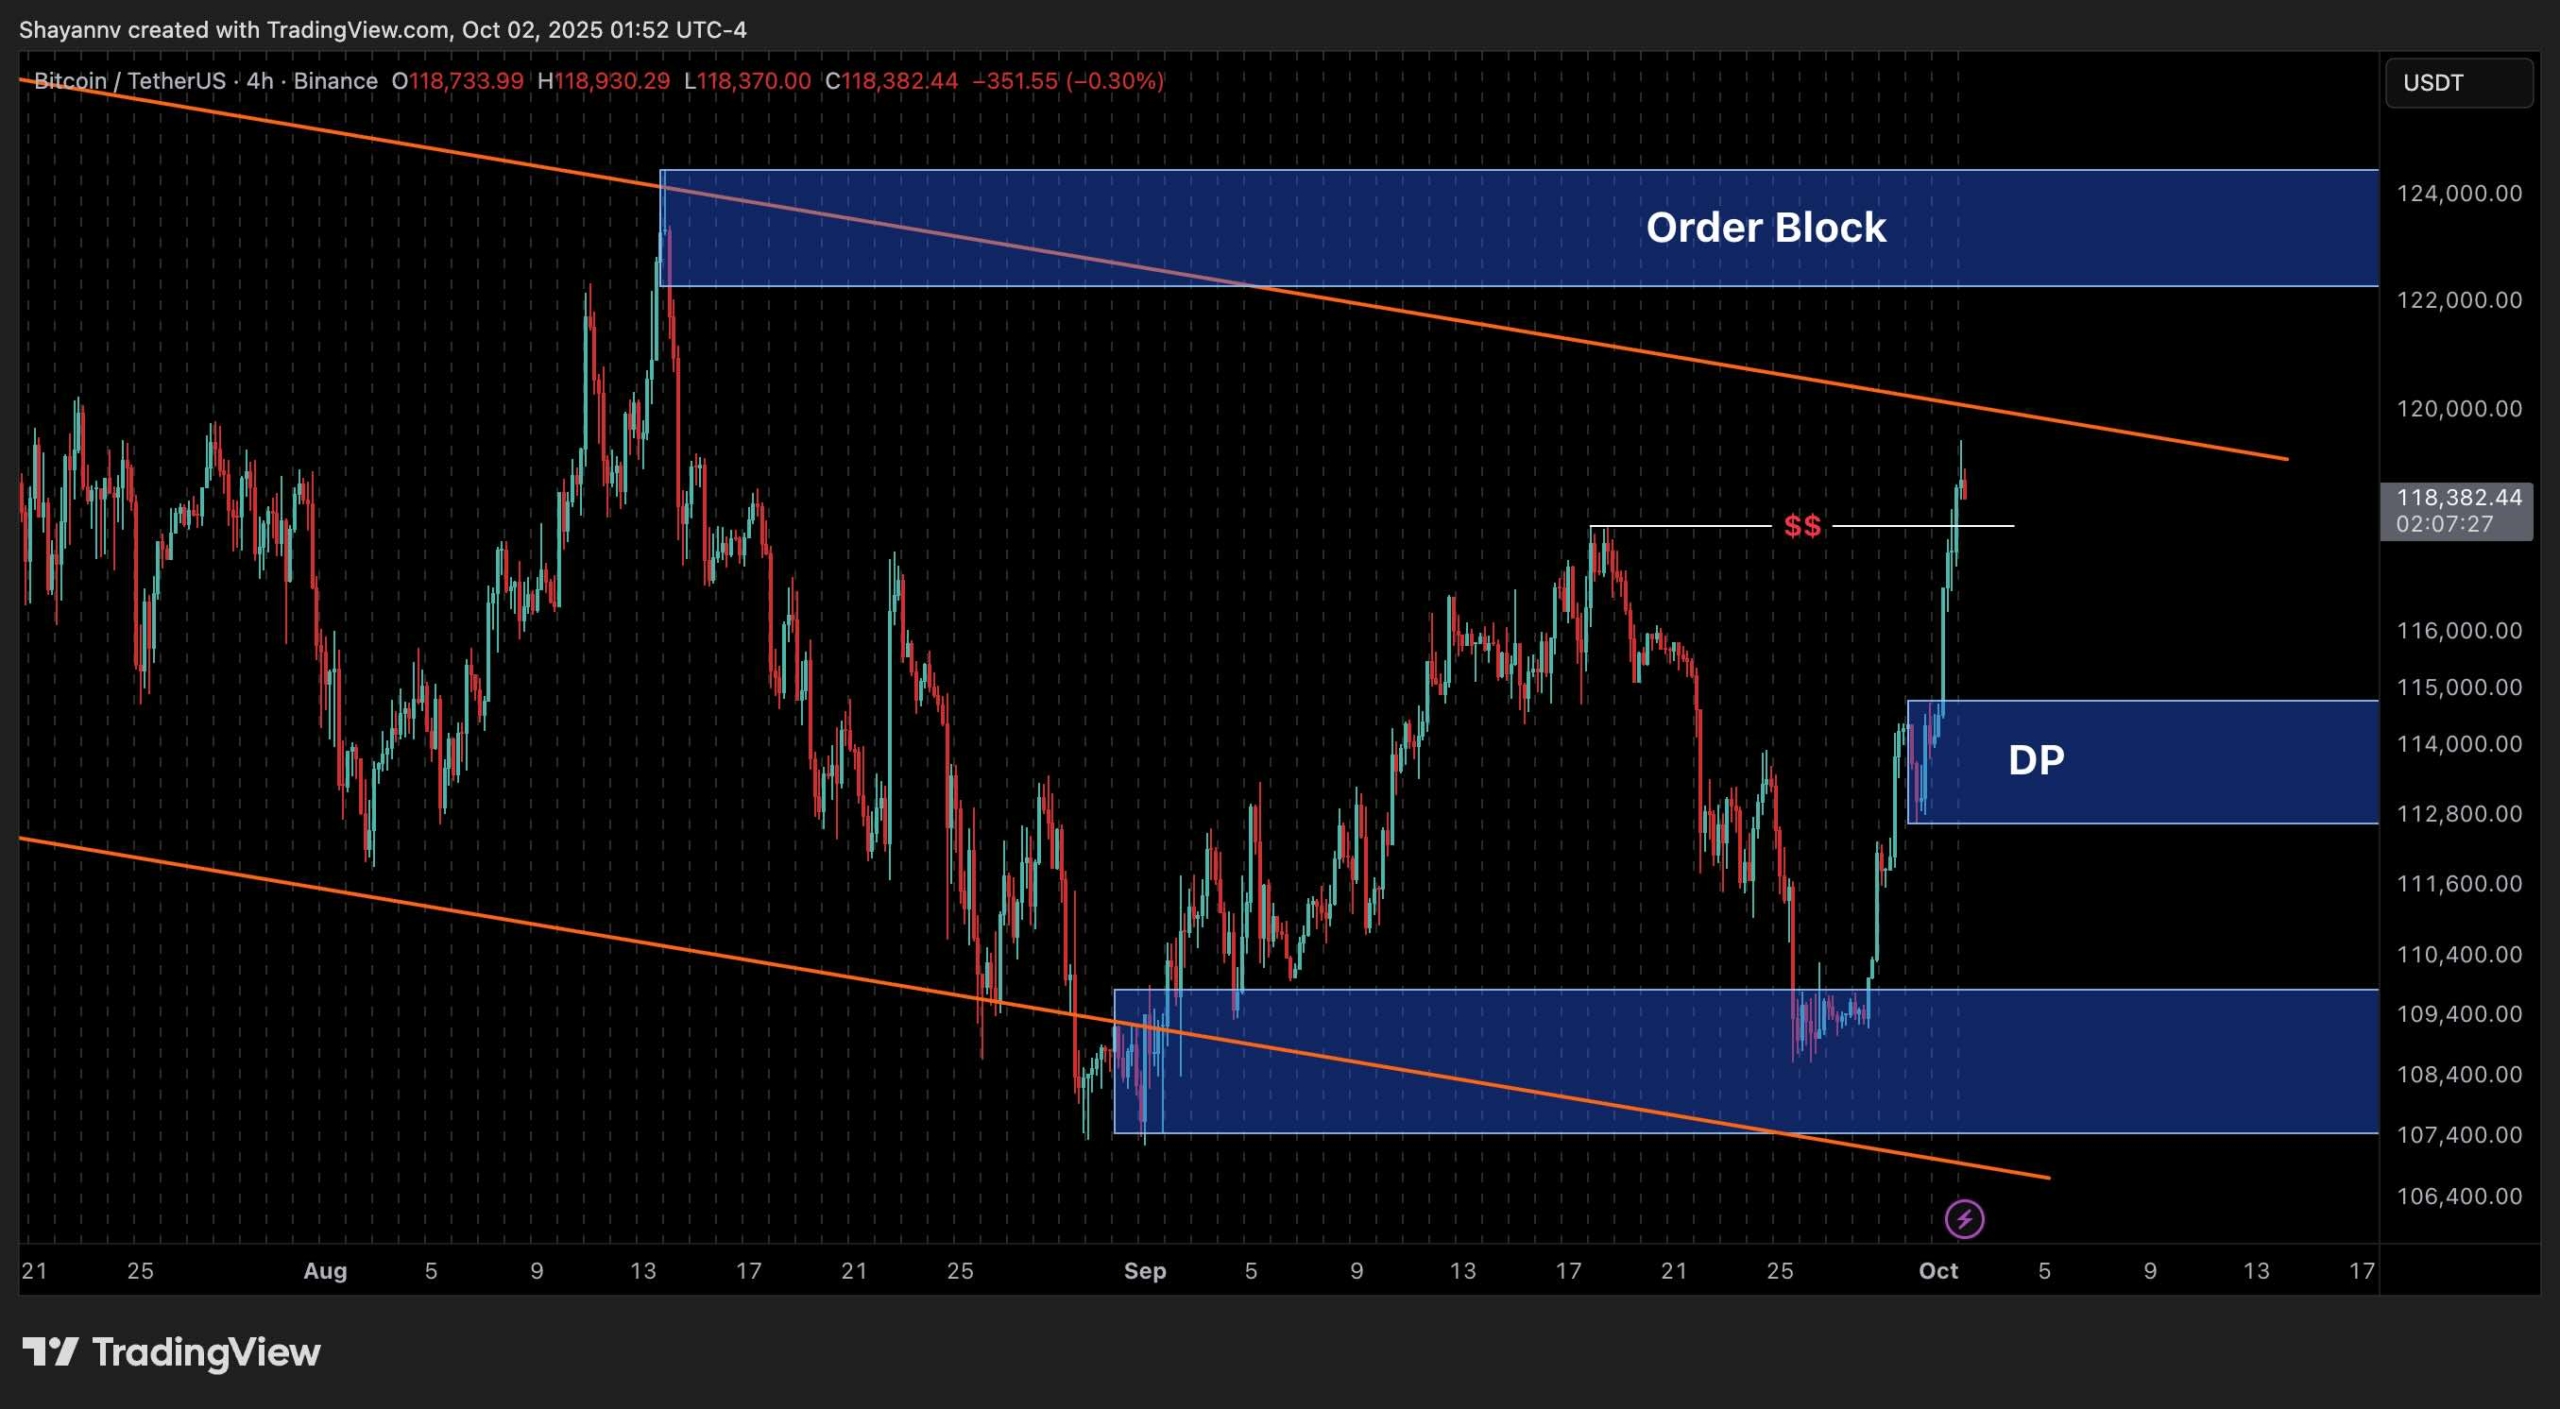
The 4-hour structure illustrates the breakout most clearly. After consolidating above $114K, Bitcoin broke through descending resistance, sweeping buy-side liquidity above $116K and pressing into the $118K liquidity pool.
If a pullback unfolds, the $114K–$115K demand block is the key decision point. Sustained bids here would provide the fuel for another push into the $120K–$124K supply cluster. Failure to defend it, however, could drag the price back toward $110K, though this currently appears less likely, given the momentum.
On-chain Analysis
By Shayan
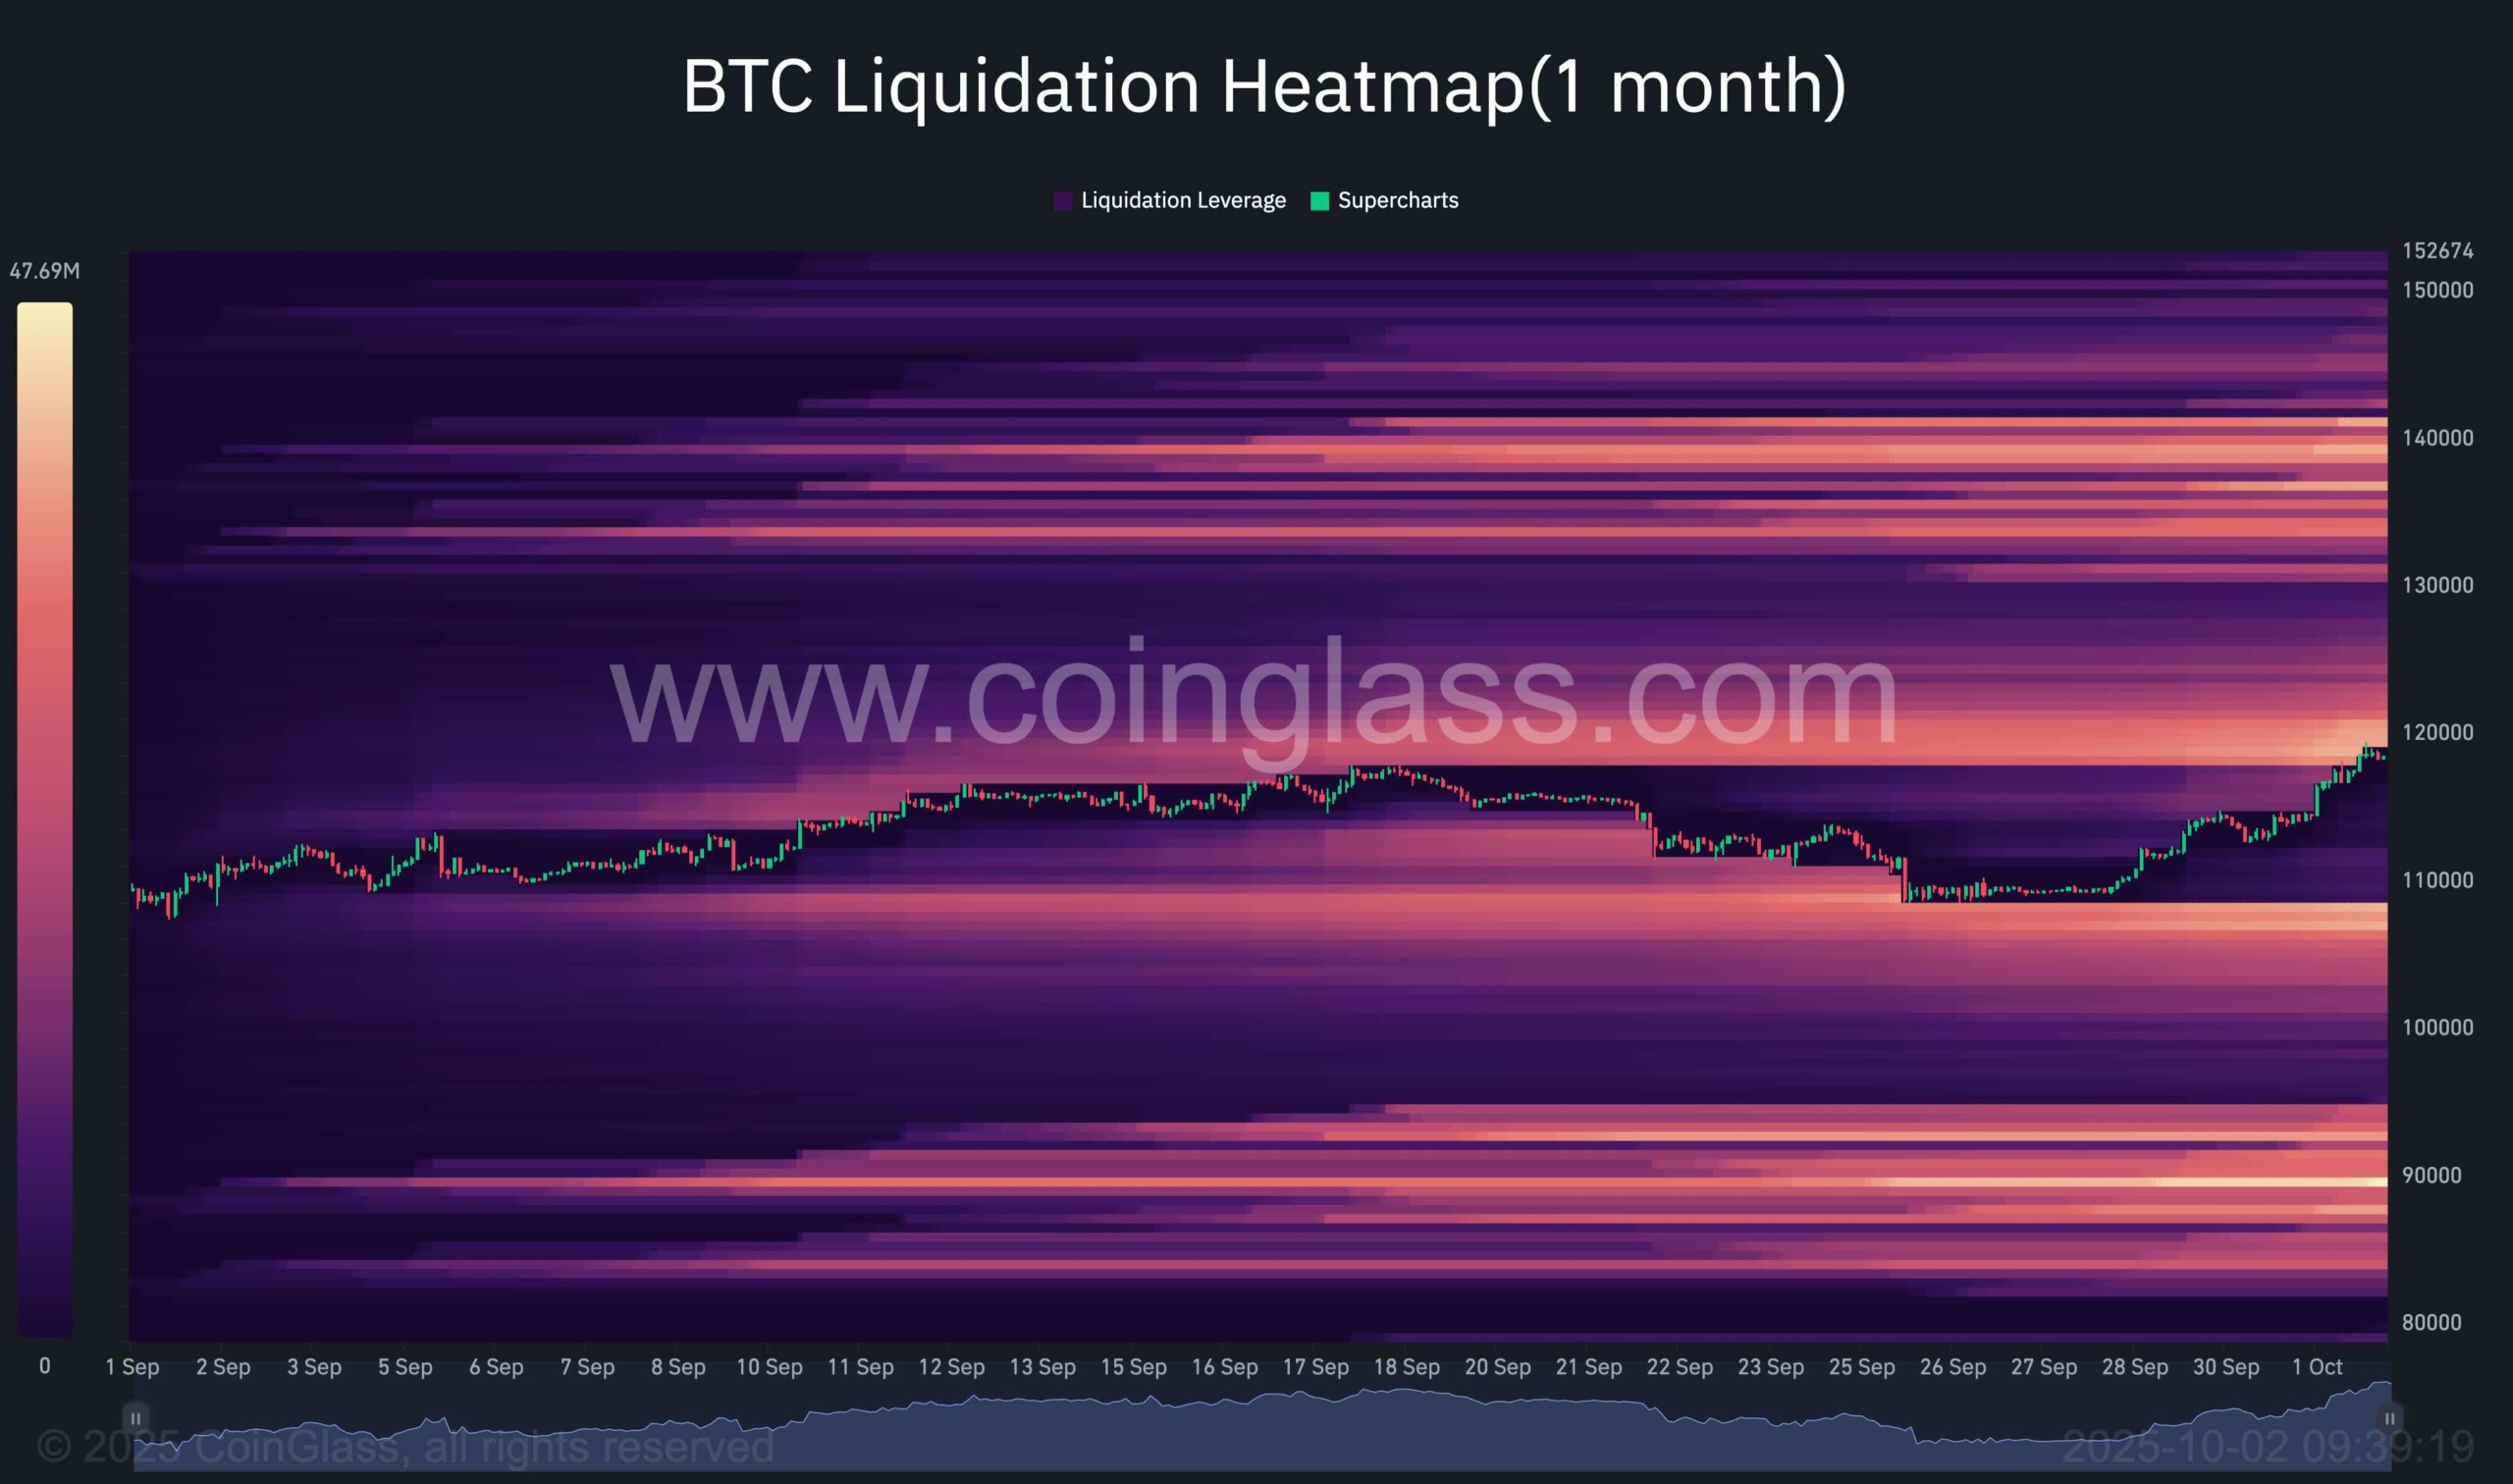
The liquidation heatmap further validates the technical picture by highlighting the dense liquidity clusters currently in play. As Bitcoin rallied from the $109K demand base into the current range, a significant portion of short positions was forced out of the market, which fueled the impulsive move higher.
The heatmap now shows that a particularly heavy concentration of liquidity has formed just above the $118K–$120K region, which is exactly where the price is currently facing resistance. This cluster reflects a build-up of short positions at that level, and if Bitcoin sustains momentum above $118K, the probability of that liquidity being swept grows substantially. The forced liquidations triggered by such a move could act as a catalyst for an extended rally, pushing the asset deeper into the $120K–$124K supply zone.
Beyond this immediate resistance, the heatmap also highlights much larger liquidity concentrations sitting above the $124K swing highs, extending into the $130K–$135K region. These pools act as magnets for price in the medium term, suggesting that if the $120K barrier is cleared convincingly, the market may accelerate toward these higher ranges in search of liquidity.
On the downside, liquidity below current levels is far less concentrated compared to what sits overhead. This relative imbalance indicates that the path of least resistance remains tilted upward, provided that the $114K–$115K reclaimed support continues to hold. The recent rally has already flushed sellers from the $109K base and cleared a large portion of downside liquidity, leaving the market positioned to build on its breakout.
In summary, the heatmap confirms what the structural analysis already suggests: Bitcoin has entered into a new bullish phase, with shorts squeezed from lower levels and liquidity now stacked higher, making the $120K–$124K region the next key battleground. A decisive clearance of this zone could then set the stage for a move into the $124K–$130K liquidity band.