Bitcoin is flirting with fresh highs, trading between $90,658 to $91,394 after brushing up against a $91,849 peak in the past 24 hours. With a market capitalization of $1.823 trillion and a roaring 24-hour trading volume of $77.09 billion, the asset is straddling a narrow range between $86,448 and its latest high, suggesting momentum is brewing — but resistance isn’t far behind.
Bitcoin Chart Outlook
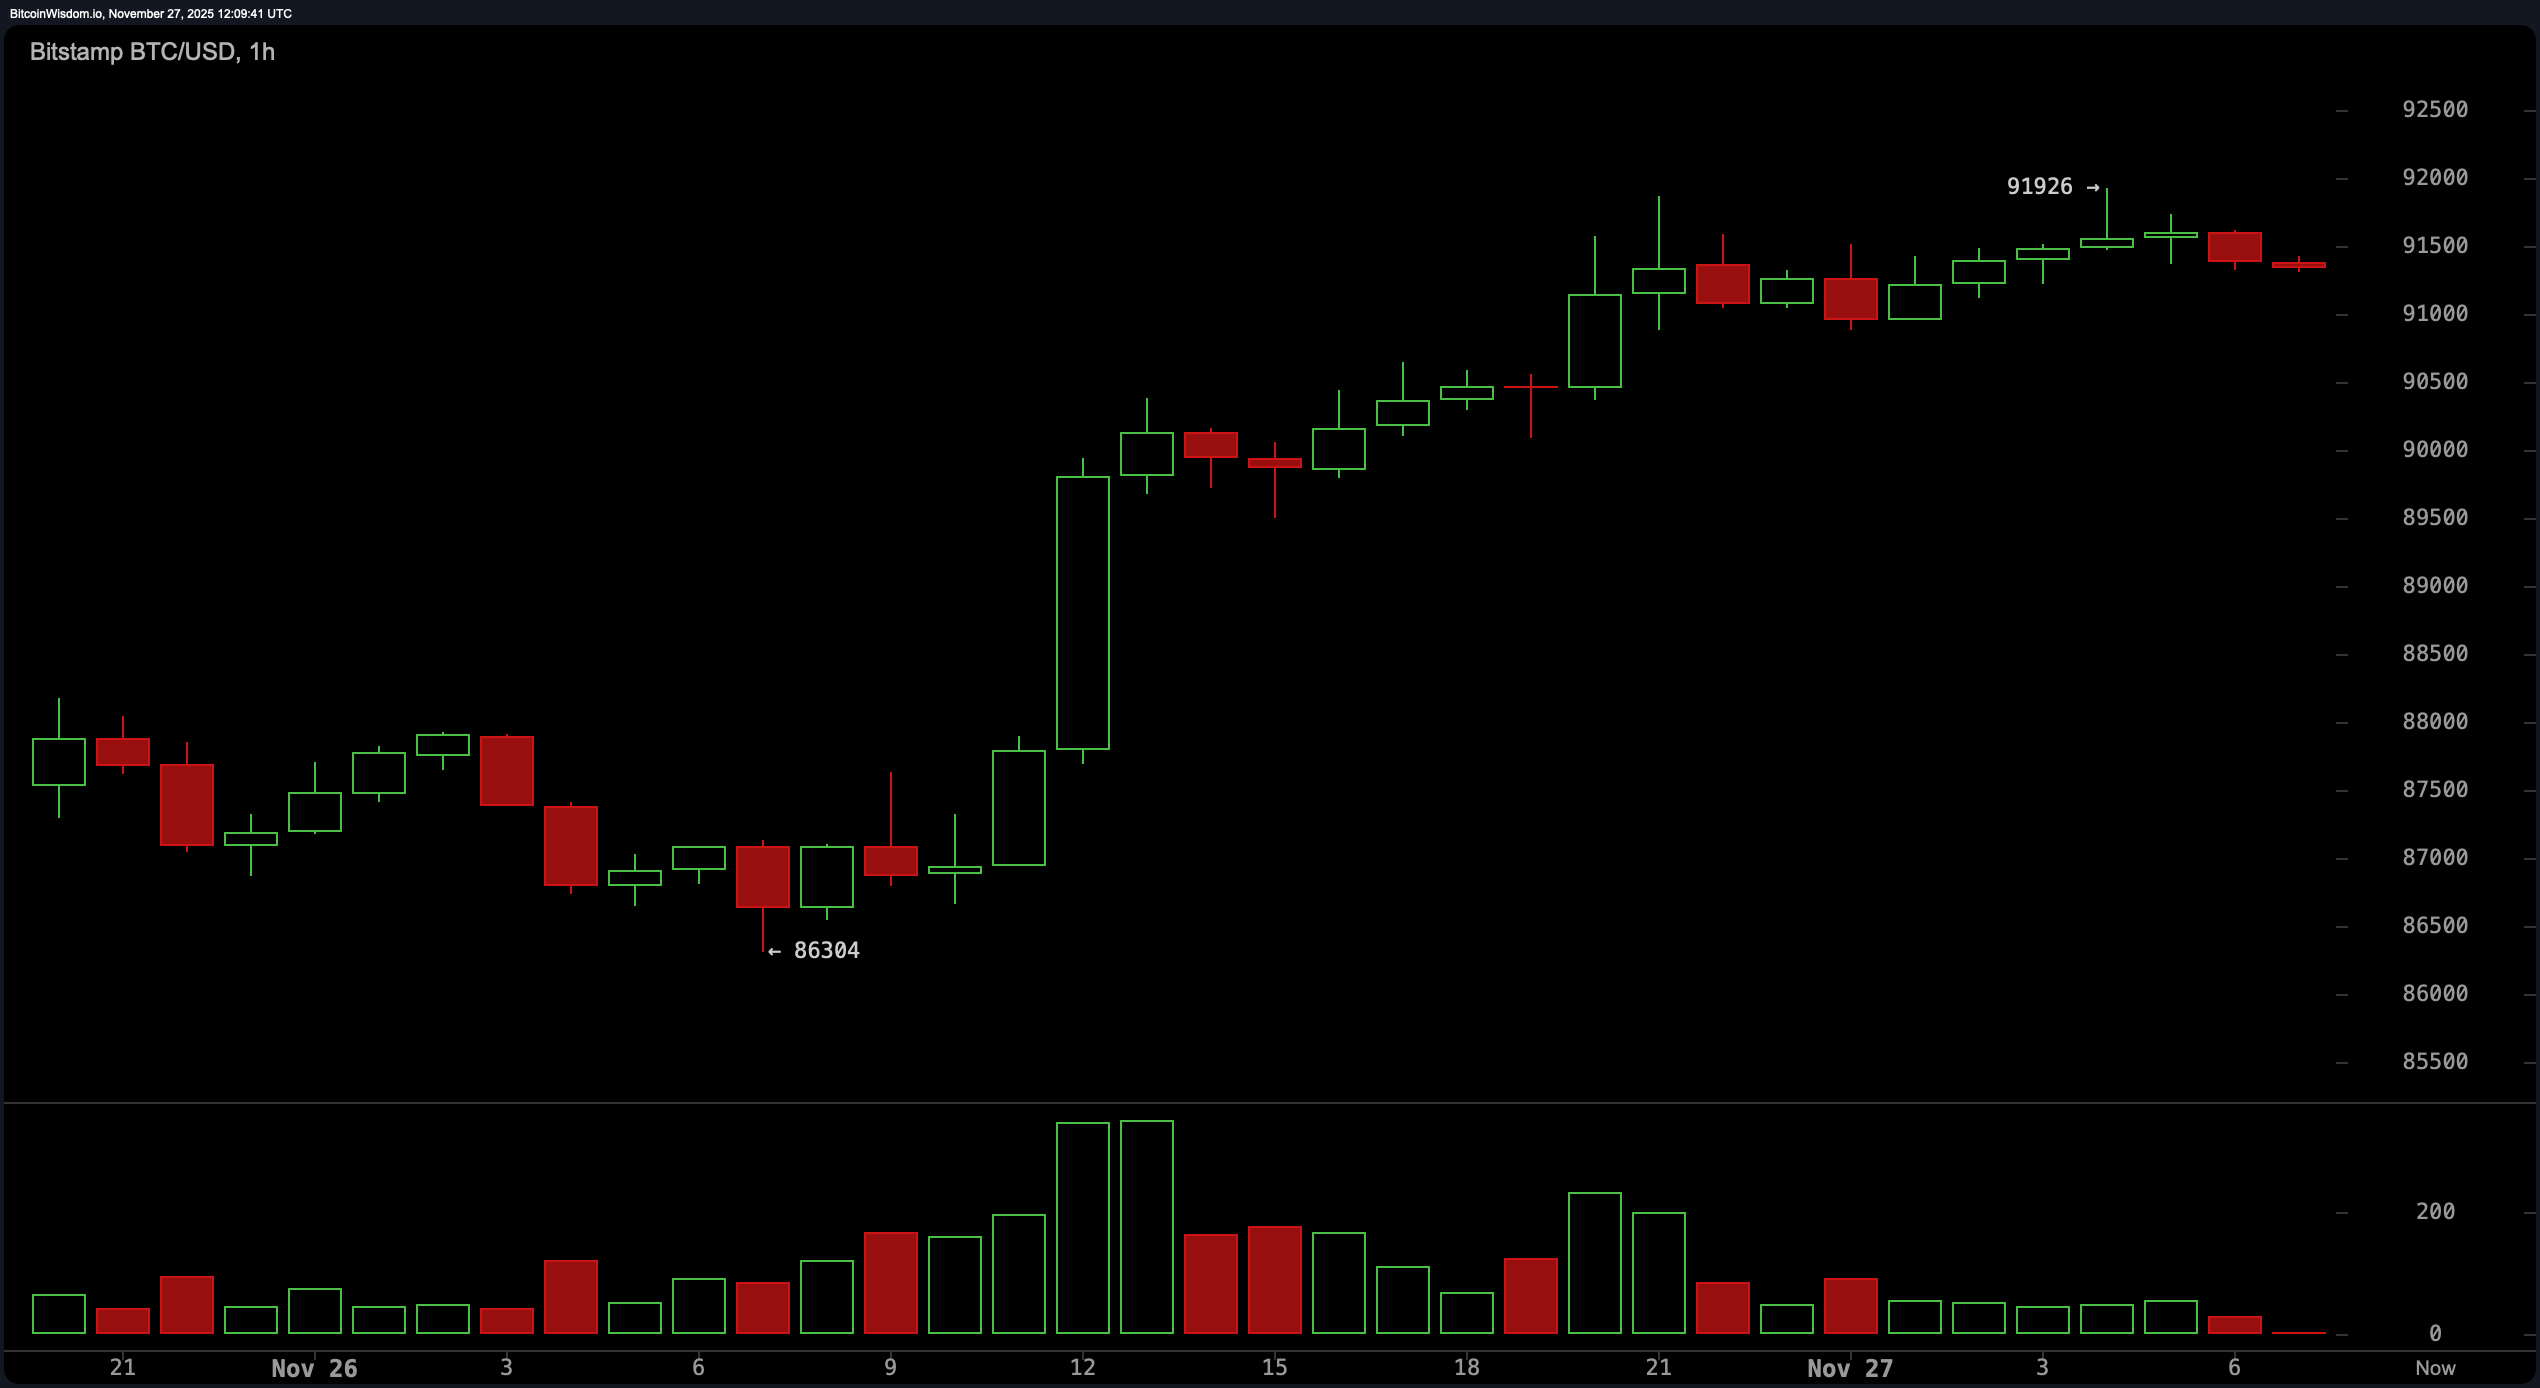
On the 1-hour chart, bitcoin has established a tight range between $91,100 and $92,000, teasing traders with a potential breakout. The rally from $86,304 to $91,926 was fast and furious, but the current pause is classic — volume has cooled and price action is coiling like a spring.
Any decisive close above $92,000 on this timeframe could trigger a short-term push toward the $93,500 level and beyond, though the cautious might wait for volume confirmation to avoid being whipsawed by false starts.
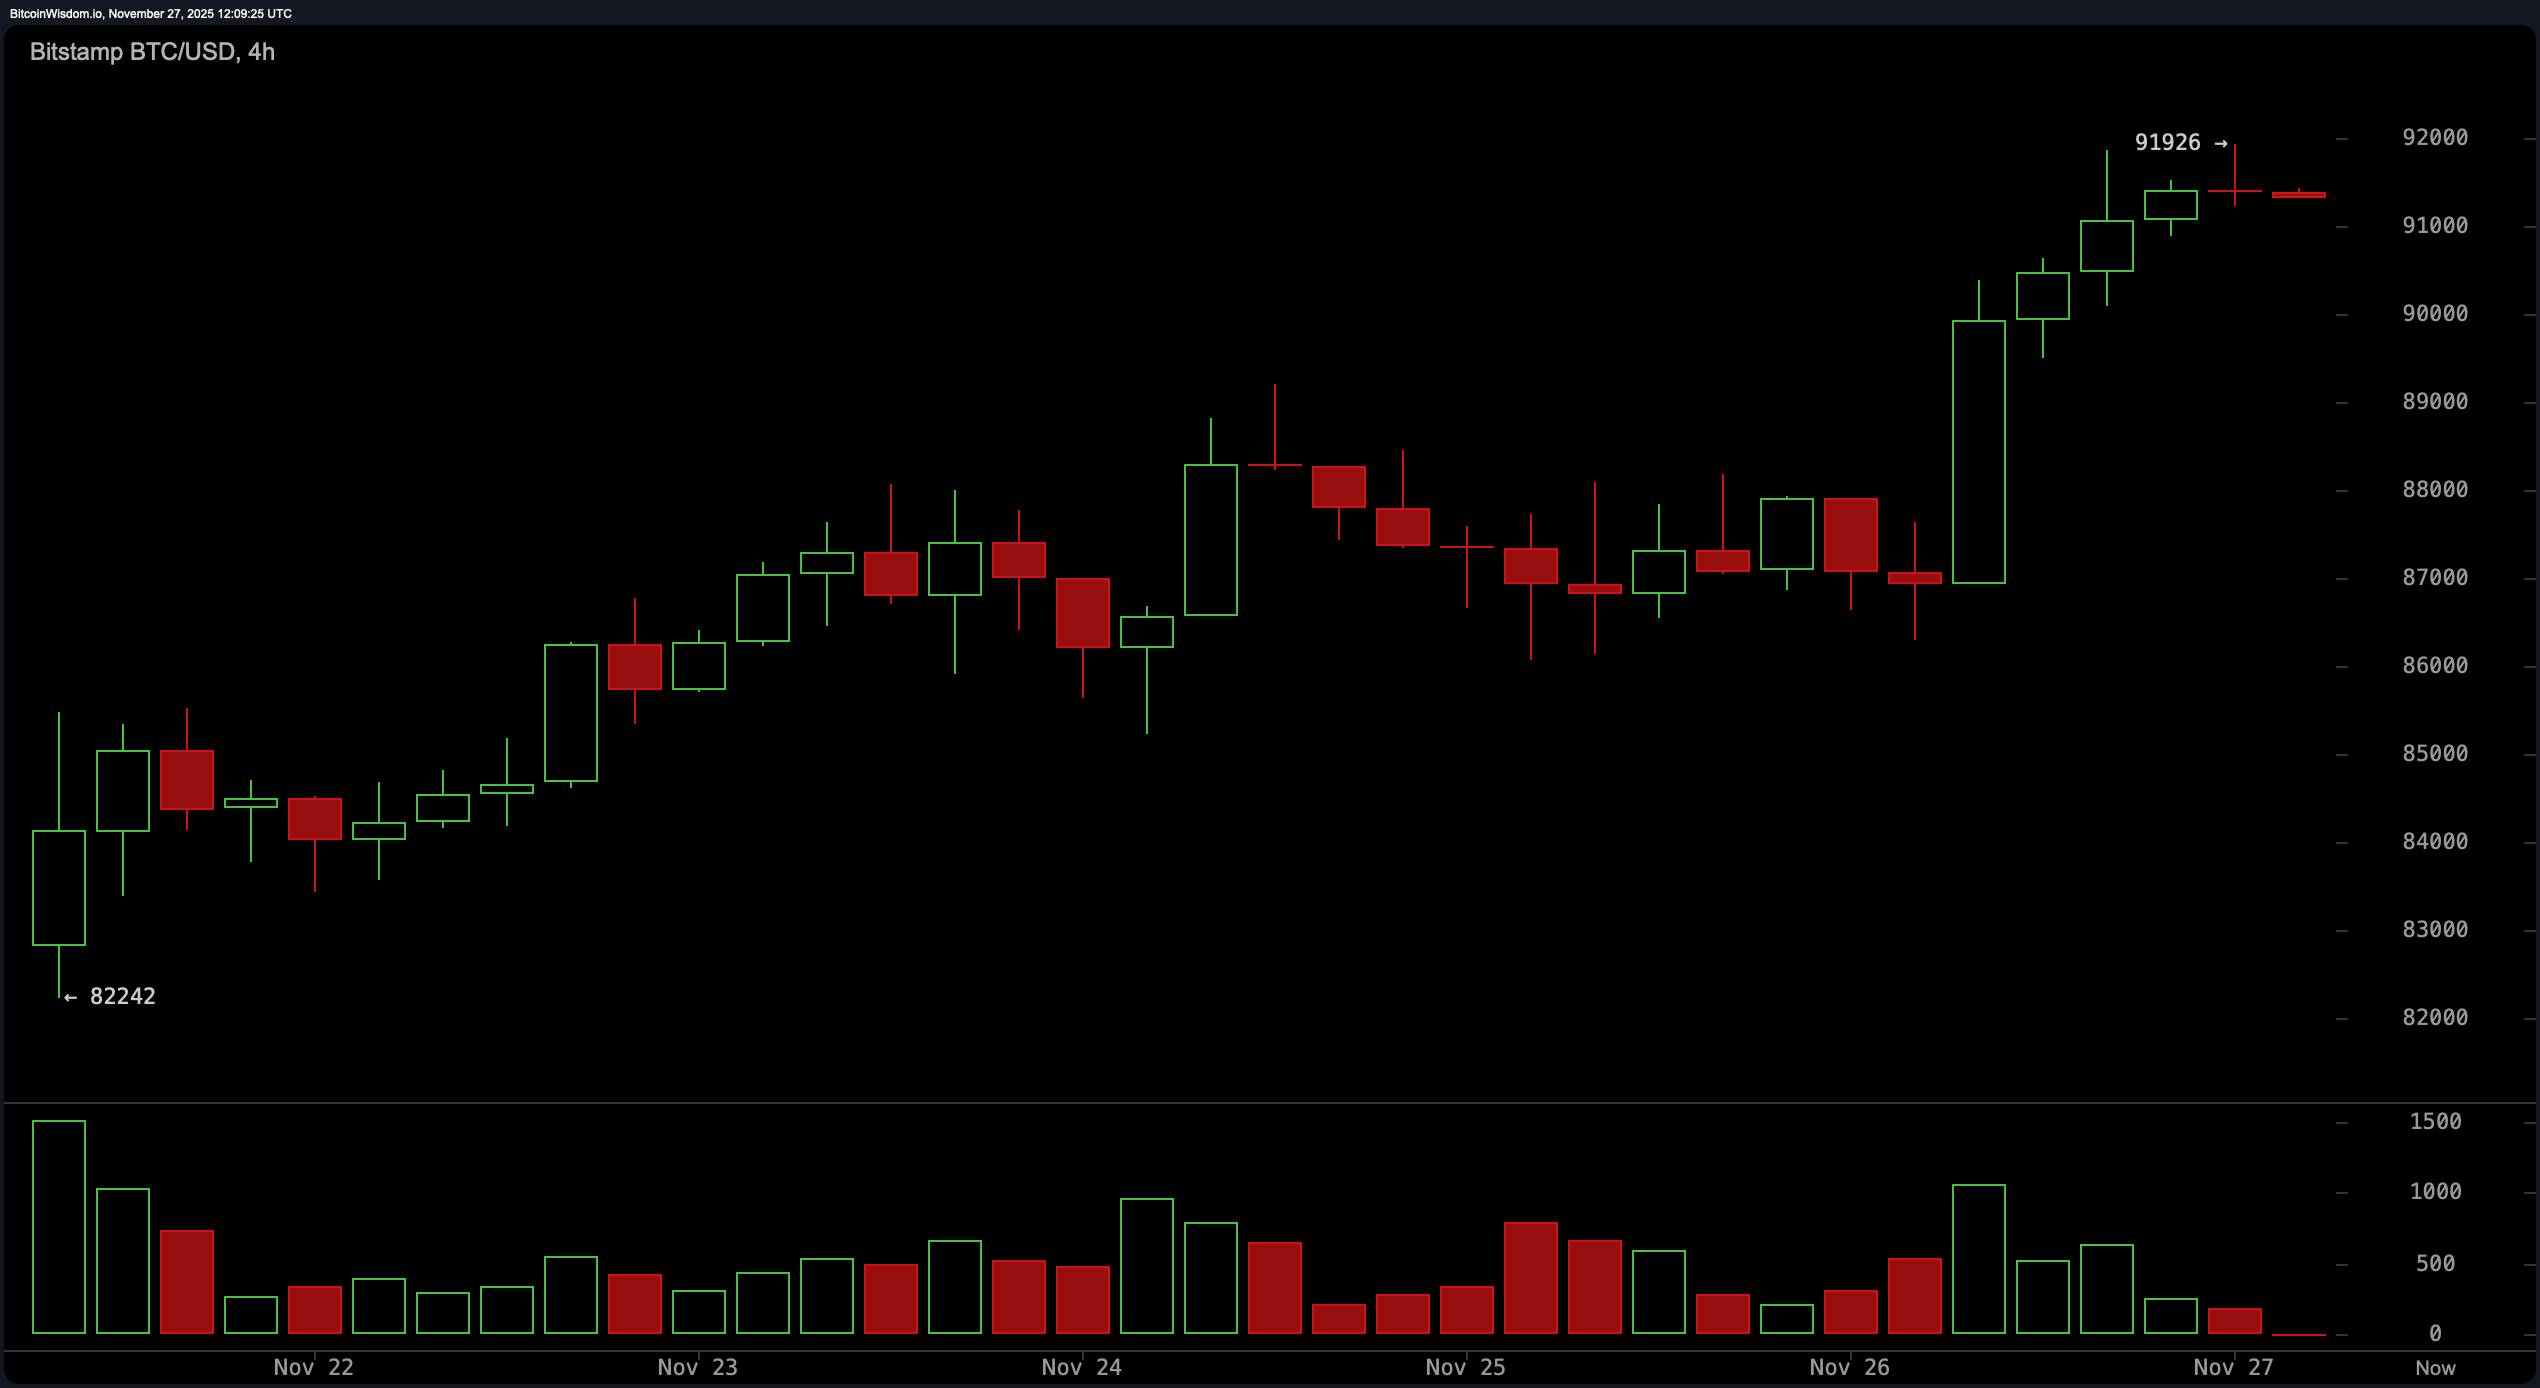
Zooming out to the 4-hour chart, bitcoin’s trajectory since bouncing from $82,242 has been clear: higher highs and constructive pullbacks. The latest sideways chop near $91,926 is textbook mid-trend digestion. Buyers remain in control, as evidenced by strong volume on green candles and tame red pullbacks. Entry opportunities are setting up between $89,000–$89,800 for those seeking structure, or $90,500 for the momentum chasers looking to capitalize on dip reclaims.
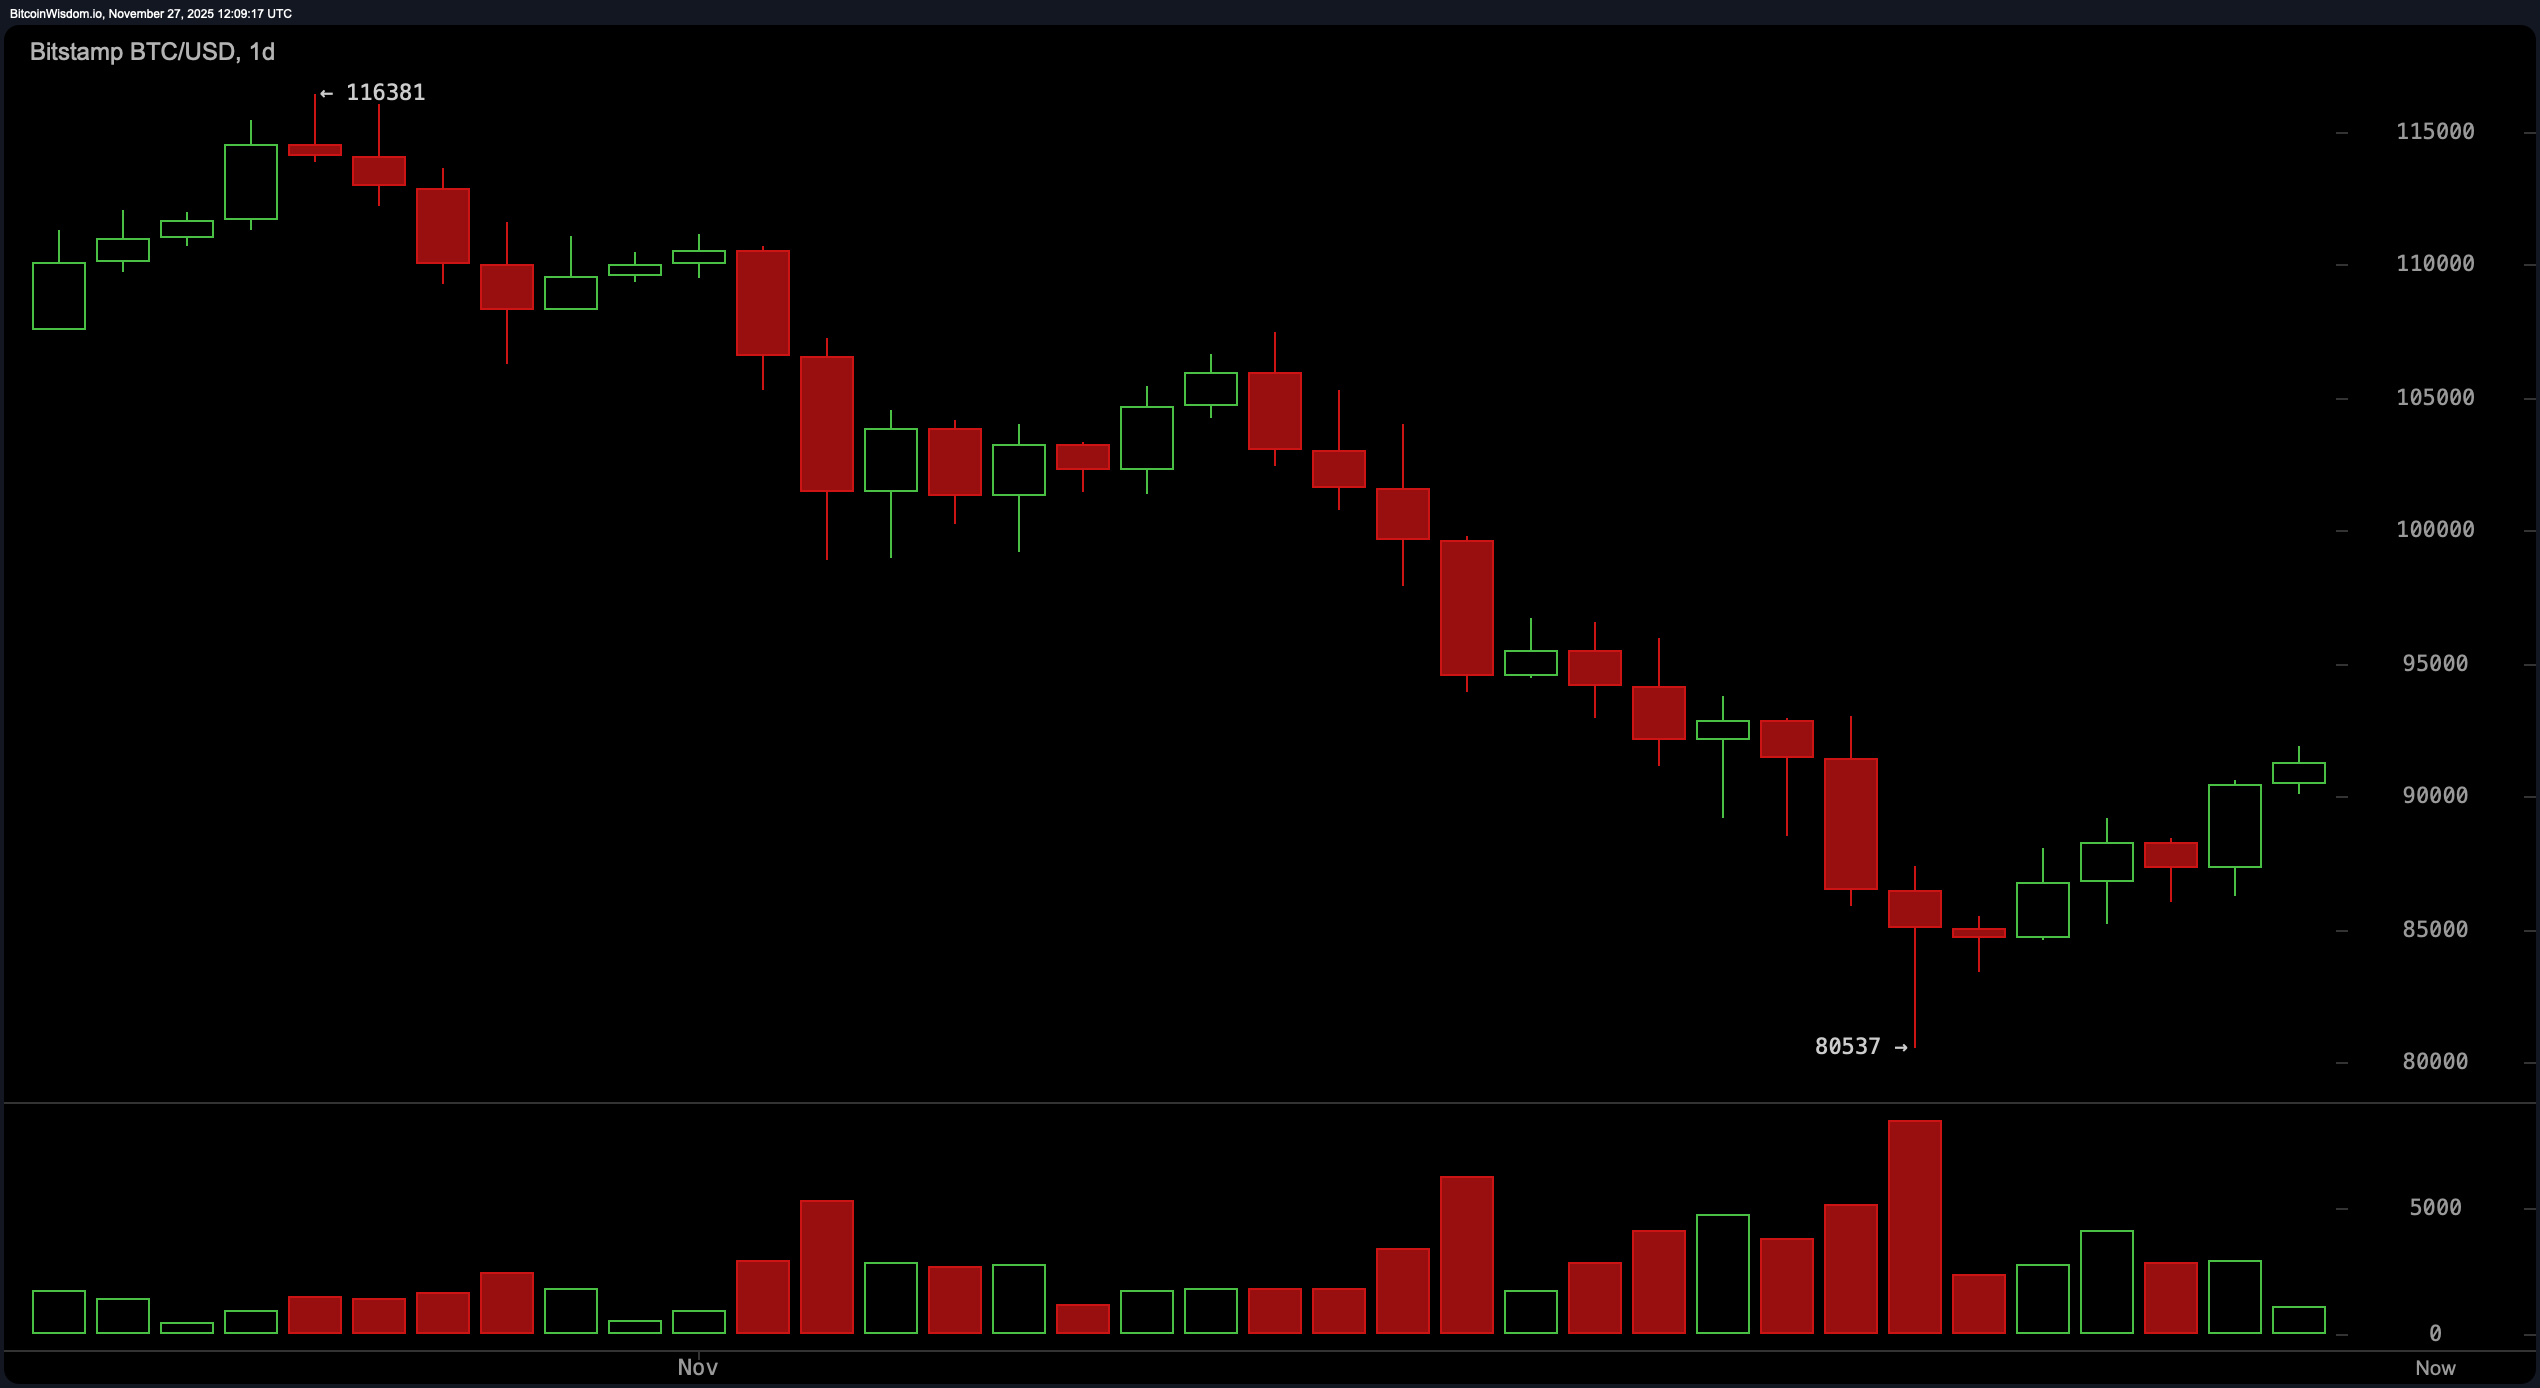
Now the daily chart tells a different story — it’s the wise elder sipping tea, watching the youth sprint around. Bitcoin has formed a clean bottom near $80,537, and early signs of accumulation are emerging with a pattern of higher lows. However, let’s not kid ourselves: this macro trend is still heavy. Resistance at $92,000–$94,000 is stiff, and the real test lurks around $100,000–$102,000. This is not uncharted territory, but it is historically a supply-laden battleground.
Oscillators aren’t revealing any strong convictions — the relative strength index (RSI) sits at 41, the stochastic at 42, and the commodity channel index (CCI) at -33, all suggesting a neutral tone. The average directional index (ADX) at 44 confirms a trend is brewing but hasn’t fully matured. Meanwhile, momentum is showing a modest pop at -725, and the moving average convergence divergence (MACD) level at -4,748 aligns with a shift toward upward momentum. Not explosive, but definitely not dormant either.
As for moving averages, bitcoin is caught in a tactical standoff. The 10-period exponential moving average (EMA) at $90,023 and 10-period simple moving average (SMA) at $88,493 are both supportive. But further out, the picture gets murky — every moving average from the 20-period to the 200-period, both exponential and simple, remains above the current price and in declining posture. That’s a lot of overhead friction, signaling that while short-term strength is undeniable, long-term recovery has its work cut out.
Bull Verdict:
If bitcoin holds above $89,000 and reclaims $92,000 with conviction, the path toward $94,000 and possibly the $100,000–$102,000 region opens up with increasing probability. Momentum across lower timeframes supports continuation, and as long as volume backs the breakout, bulls have every reason to lean in.
Bear Verdict:
Failure to sustain above $91,000 and a break below $89,000 could unravel recent gains, dragging price back toward the $86,000–$87,500 liquidity pocket. With all major moving averages still stacked overhead and daily resistance zones looming, the bears aren’t out of the picture just yet.
FAQ ❓
- Where is bitcoin trading now? bitcoin is currently priced around $90,658 to $91,394, hovering just below short-term resistance.
- What’s the next key level to watch?A decisive move above $92,000 could open the door to the $94,000–$100,000 zone.
- What support levels are holding?The $89,000–$90,000 area is acting as critical short-term support.
- Is momentum favoring bulls or bears?Lower timeframes show bullish structure, but higher timeframe resistance still dominates.