Bitcoin price climbed above the $84,000 resistance and is holding near $85,000, as a sharp increase in buying pressure triggers a fresh broader market rally. Binance net taker volume reportedly surged to $618 million, while short liquidations added further fuel to $BTC’s upside move. The breakout has improved Bitcoin’s near-term structure, but traders now face a crucial test near the $88,761 two-year moving average. A sustained move beyond this zone could bring $90,000 into focus.
$618M Buying Surge Signals Aggressive Derivatives Activity
Bitcoin’s latest rally has been accompanied by a sharp rise in net taker volume on Binance. On-chain data shows the metric climbing from approximately $11 million to $618 million within an hour, highlighting a sudden increase in aggressive buying activity.
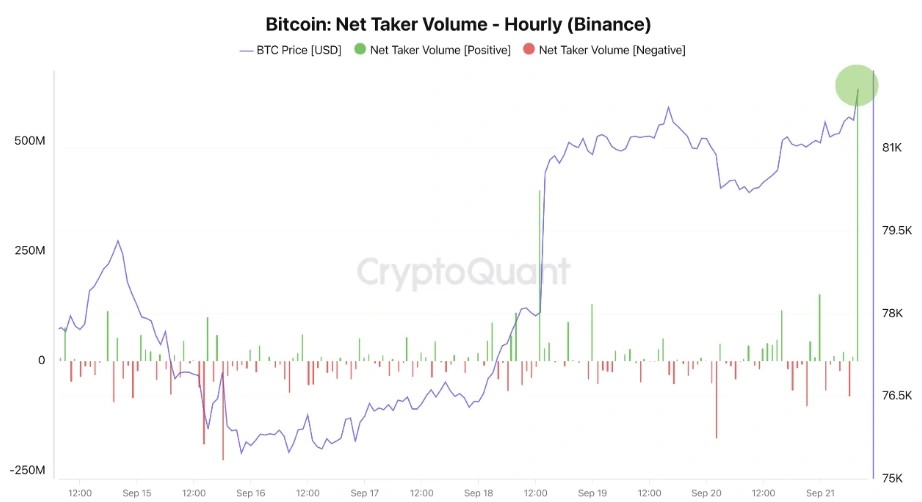
Net taker volume tracks the balance between market-buying and market-selling pressure. A strong positive reading suggests that traders are executing buy orders against available liquidity, rather than waiting for lower entry levels. The move also coincided with significant short liquidations across the crypto market. As bearish positions are forcibly closed, exchanges buy back assets to settle those positions, potentially accelerating the upside move.
However, liquidation-driven momentum does not automatically confirm sustained spot accumulation. Bitcoin will need continued demand after the initial short squeeze to establish a more durable recovery.
Bitcoin Price Analysis: $BTC Eyes $90K After Breaking Above $84K
Bitcoin’s price chart shows a breakout above the $84,000–$84,500 resistance zone, supported by increased trading activity. The region now becomes an important area to monitor for support. Bitcoin’s recovery above $80,061, its reported one-year moving average, marks an important development in the broader chart structure. The reclaim suggests that $BTC has moved back above a key trend reference after facing pressure during previous sessions.
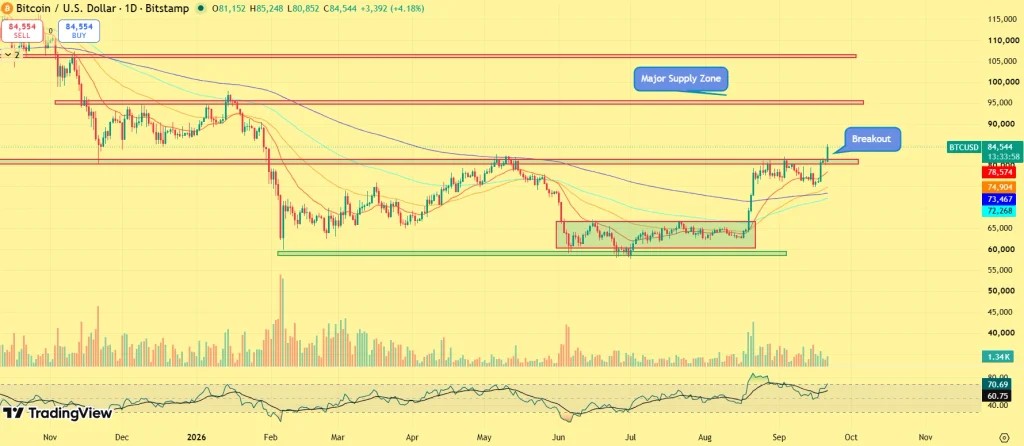
Holding above it would preserve the current bullish structure, while a sustained move back below $84,000 could signal a failed breakout and expose $BTC to renewed consolidation. On the upside, the $88,761 two-year moving average is the next major technical reference, followed by the psychological $90,000 resistance.
A decisive daily close above this zone could strengthen the recovery structure. Conversely, rejection near the higher resistance area may trigger profit-taking and a retest of the $80,000 region, where the one-year moving average could provide initial support.
Can Bitcoin Bulls Push Toward $90K?
Bitcoin’s price move above $84,000 reflects stronger short-term buying pressure, but the rally now needs sustained participation beyond derivatives-driven liquidations. Reclaiming the one-year moving average has improved the technical backdrop, while the approaching two-year moving average could determine whether the recovery extends further. Continued volume and stable demand would support the breakout narrative. However, fading buying pressure could leave $BTC vulnerable to consolidation as traders reassess positions near higher resistance.
Leave a Reply
You must be logged in to post a comment.