After a strong breakout that puts the six-digit $100,000 level back into consideration, Bitcoin has returned to acceleration mode, rising above $85,000. According to the provided market data, Bitcoin is currently trading at about $85,250, up about 4.4 percent over the last day and 9% over the last seven days.
Can Bitcoin accelerate higher?
The daily candle extended a recovery that began in the $75,000–$76,000 range, briefly reaching about $86,600. From a technical standpoint, Bitcoin has overcome a significant challenge. $BTC has now clearly surpassed the 200 day moving average, which had previously served as resistance between $80,000 and $81,000.
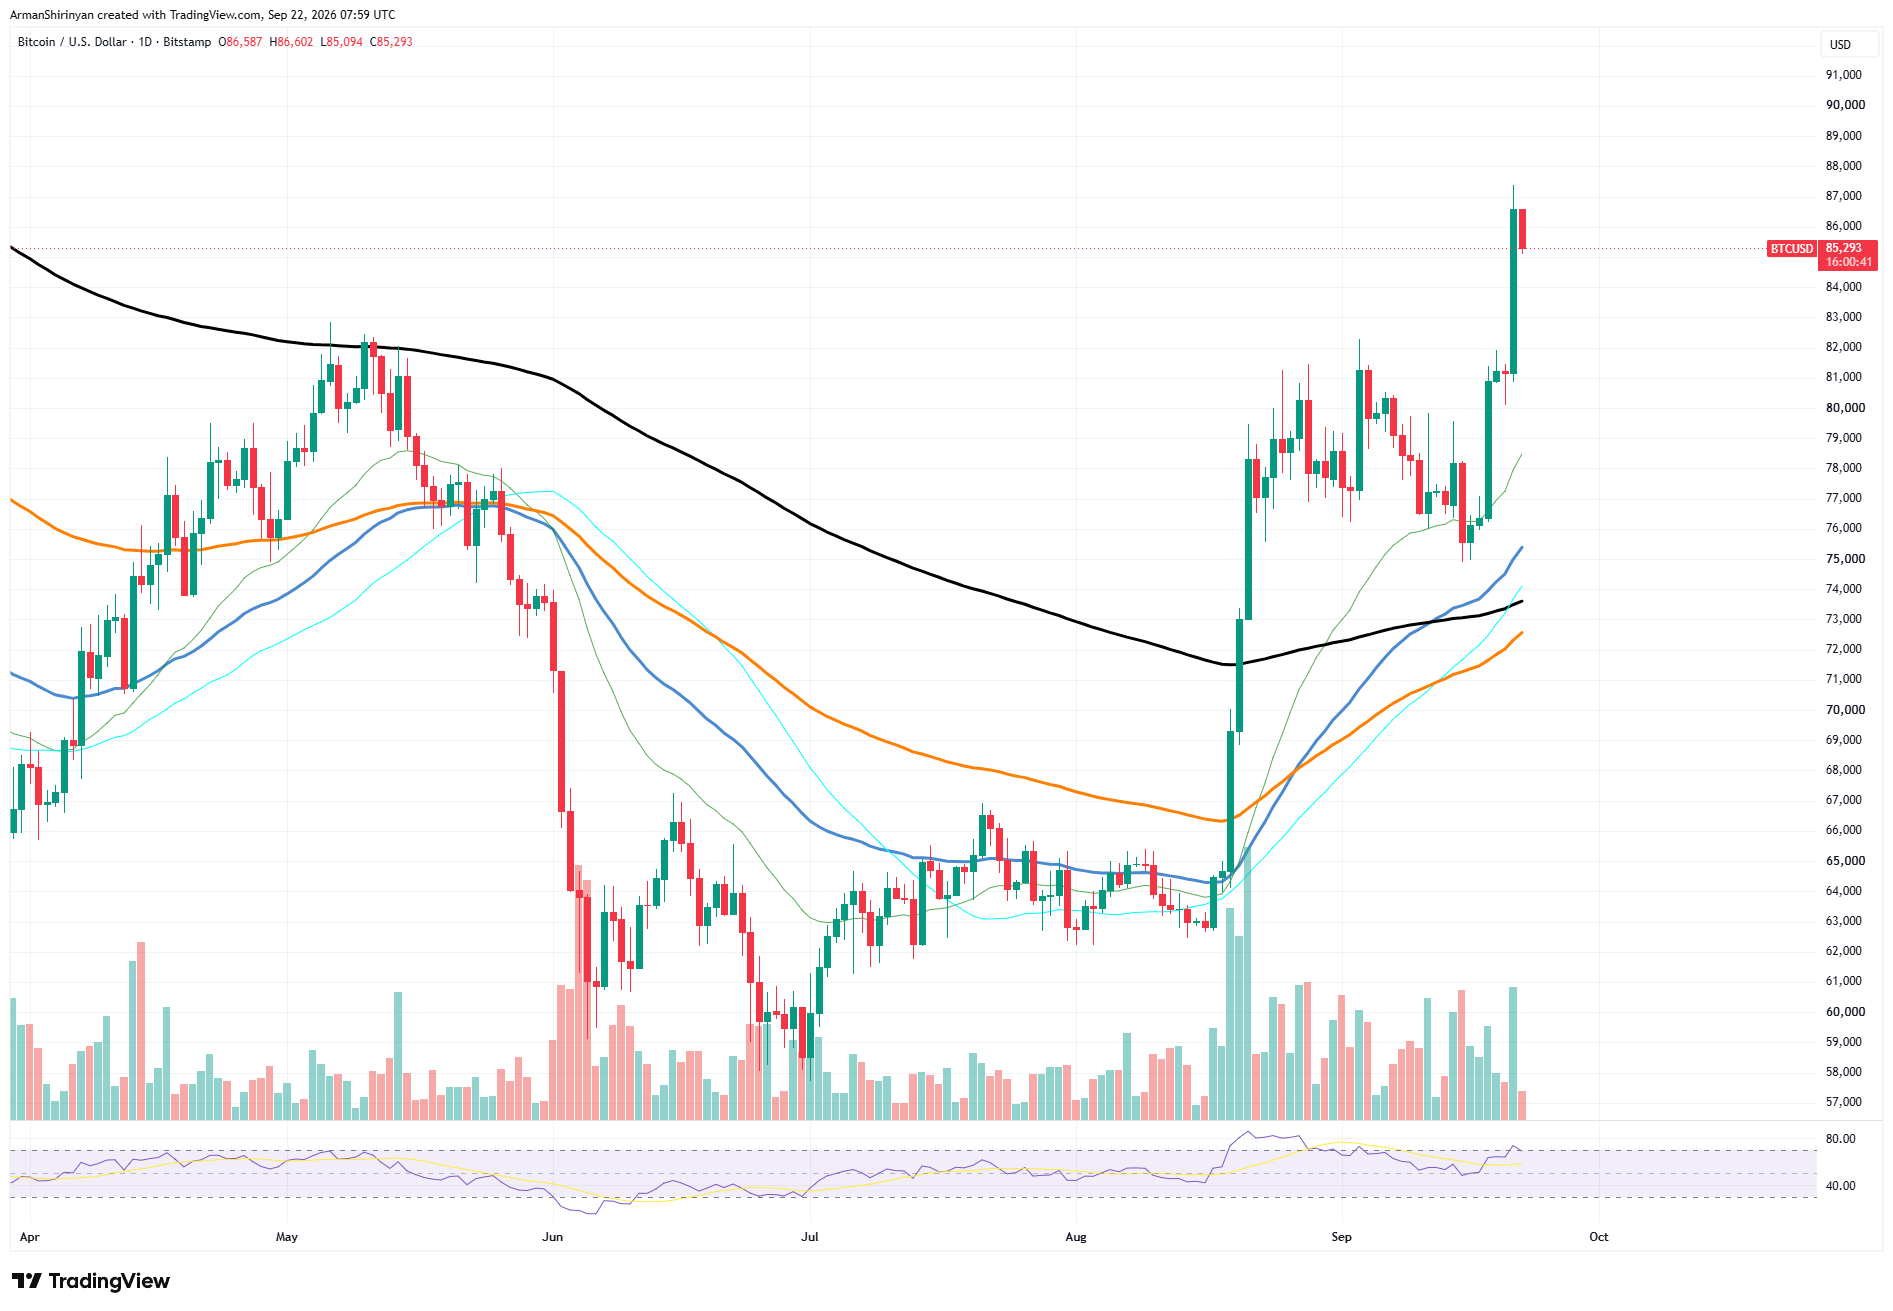
At roughly $72,000 to $78,000, all shorter moving averages are significantly lower and have begun to rise. The immediate resistance is found between $87,000 and $88,000. Before $90,000, a successful breakout would leave comparatively little visible resistance. From there, $100,000 becomes the clear psychological goal, even though Bitcoin would still need to rise by about 17% from its current price to get there.
Derivative data offers an additional intriguing component. Based on the provided CoinGlass data, about $612 million in Bitcoin positions were liquidated in the last 24 hours. Just $77 million came from longs, compared to roughly $535 million from shorts. This implies that the breakout caused a significant short squeeze.
On-chain positioning is bullish
The positioning, though, does not yet appear to be entirely bullish. With an overall account long/short ratio of 0.9026 on Binance and 0.93 on OKX, short accounts continue to slightly outnumber longs on those platforms. The top traders on Binance hold different positions; their position-based long/short ratio is roughly 2.27.
If Bitcoin attacks the $87,000–$90,000 range, this divergence may become significant. Remaining bearish positions might be forced to close due to further appreciation, which would increase mechanical buying pressure. On the other hand, $BTC will require real spot demand to sustain momentum once short liquidations end. For the time being, the technical framework allows for continuation.
$BTC is trading above all major moving averages displayed, and the RSI has recovered toward the mid-60s without reaching extremely overbought conditions. Thus, the path to $100,000 is still theoretically open, but the initial real test lies between $87,000 and $90,000.
Stronger proof that the most recent breakout is a sustainable trend expansion rather than another transient squeeze would be provided by holding above the previous $80,000–$82,000 resistance during any pullback.
Leave a Reply
You must be logged in to post a comment.